Evidence-first notes on bioscience and deep tech, at the edge of the lab and the market. Information only — not investment advice, and not medical advice. The study discussed below is a peer-reviewed pooled individual-participant-data analysis of nine randomized trials, published in Nature Medicine. It estimates short-term changes in blood pressure, kidney function, and potassium — it is not an outcomes trial, and nothing in it should be read as guidance to start, stop, or adjust any heart-failure medication.
The 30-second version
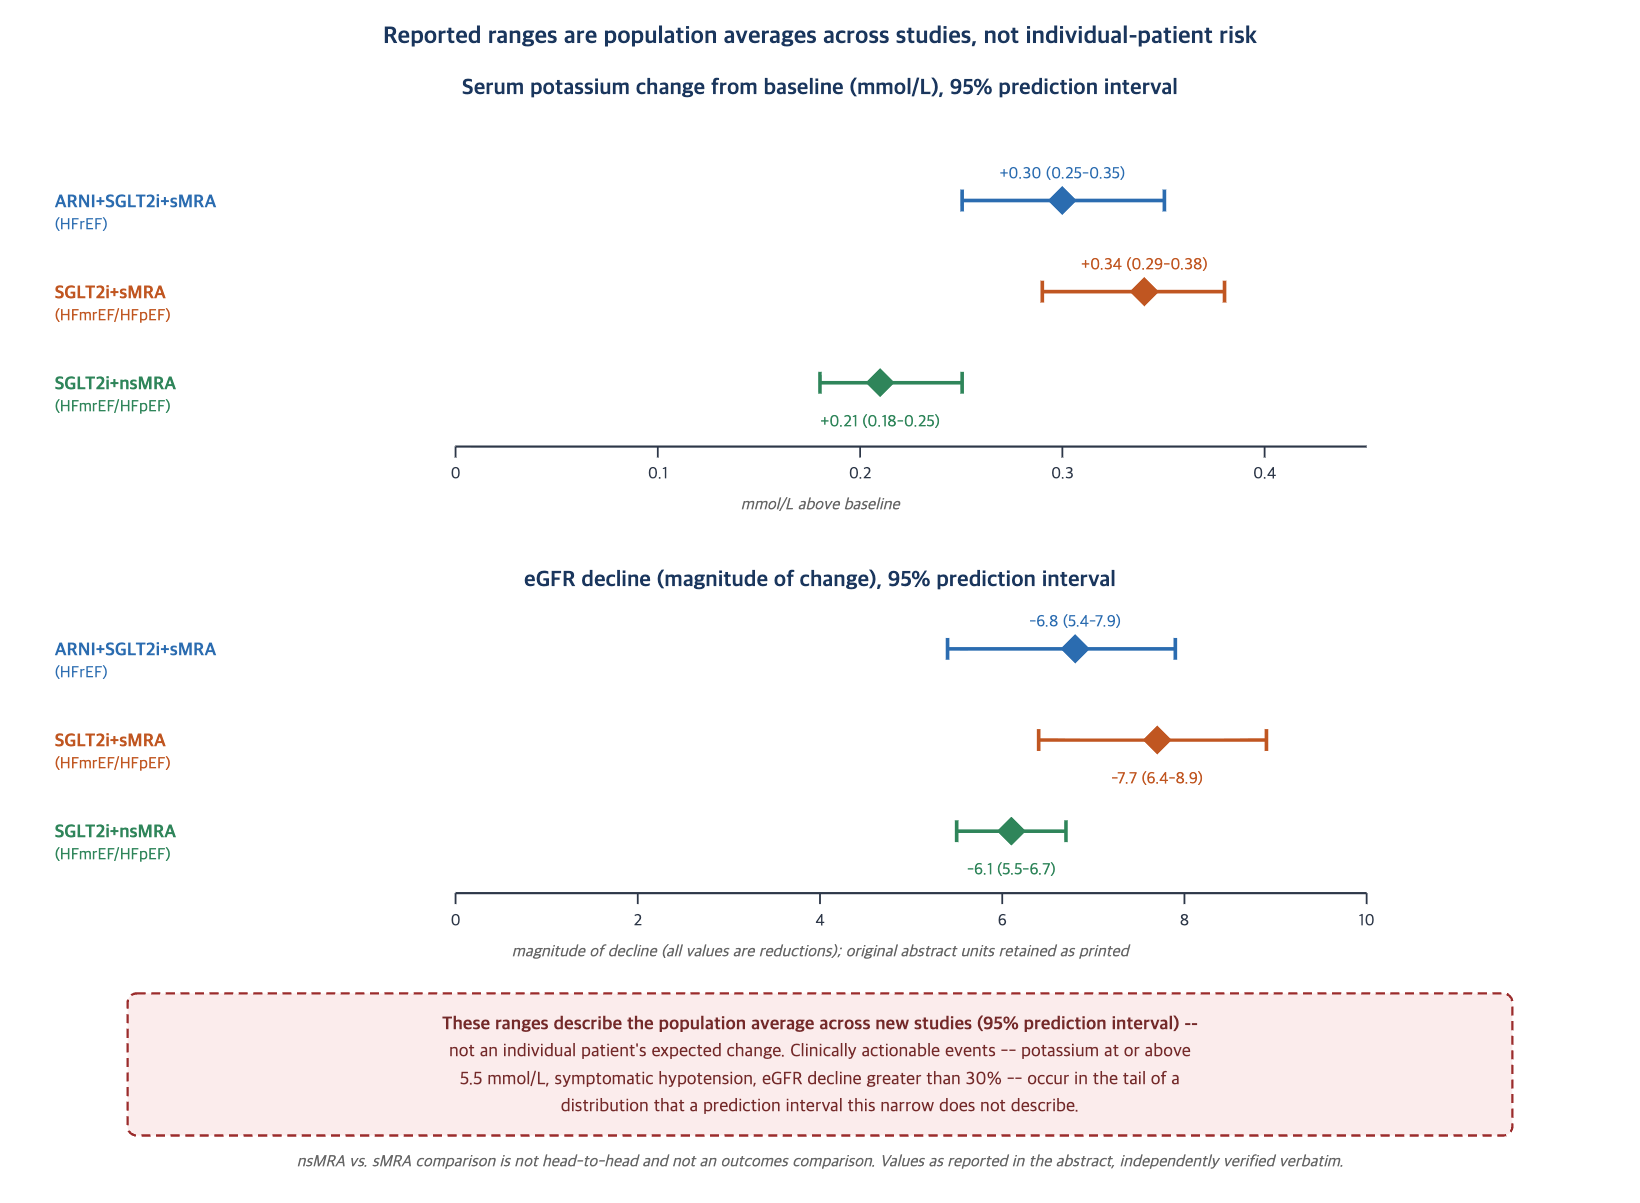
- What. Pooling individual-participant data from 9 randomized trials, 38,753 patients (16,877 with reduced ejection fraction, HFrEF; 21,876 with mildly reduced or preserved ejection fraction, HFmrEF/HFpEF), a Nature Medicine paper estimates how combinations of heart-failure drugs — ARNI, steroidal MRA (sMRA), nonsteroidal MRA (nsMRA), and SGLT2 inhibitors — move systolic blood pressure, eGFR, and serum potassium over the short term (2–12 weeks), and packages the results into a free public calculator (hfmodel.org). In HFrEF, the triple combination ARNI+SGLT2i+sMRA produced an estimated mean systolic blood pressure change of −9.2 mmHg (95% prediction interval −10.6 to −7.8), eGFR −6.8 (−7.9 to −5.4), and potassium +0.30 mmol/L (0.25 to 0.35).
- So what. This is not an outcomes trial — it estimates laboratory and vital-sign changes, not death, hospitalization, dialysis, or severe hyperkalemia, and the paper does not claim otherwise. And the ranges the abstract reports are explicitly labeled 95% prediction intervals, not confidence intervals — we independently retrieved the abstract text and confirmed this verbatim. A prediction interval does not describe the uncertainty of the group average the way a confidence interval does; in a pooled analysis like this one, it describes the range within which the true effect in a new population is expected to fall, incorporating variation between the underlying trials — and is mathematically wider than a same-data confidence interval, not narrower. Even so, the potassium interval reported here (a width of about 0.10 mmol/L around the mean) is narrower than the potassium fluctuation seen from repeated measurement within a single person — which means this range almost certainly describes something close to a population average, not an individual patient’s likely change. The clinician’s actual worry — potassium climbing to 5.5 or higher, symptomatic hypotension, a sudden 30%-plus eGFR drop — lives in the tail of a distribution, not at its mean, and this calculator was not built to describe that tail. Also: beta-blockers and loop diuretics, two of the four foundational heart-failure drug classes in current guidelines, are simply not among the model’s drug classes.
- Now what. The calculator is live today and free to use, but there is zero evidence yet that using it changes prescribing rates or patient outcomes — only that a model was built and deployed. The single most concrete, practice-relevant number in the paper: within HFmrEF/HFpEF, nonsteroidal MRA showed a smaller potassium rise (+0.21) and smaller eGFR decline (−6.1) than steroidal MRA (+0.34 and −7.7), with non-overlapping prediction intervals for potassium — a real, quantitative signal, though not an outcomes comparison and not head-to-head.
The five-minute read
The question this paper actually answers
The paper’s own framing is precise: the most commonly cited reason clinicians hesitate to start comprehensive heart-failure drug therapy is fear of hypotension, worsening kidney function, and hyperkalemia. So the authors pooled individual-level data across nine trials to answer a narrower question than “does this therapy work” — namely, “how much, on average, does an arbitrary combination actually move blood pressure, eGFR, and potassium in the short term.” That is a study about clinical inertia, not about efficacy, and it is a genuinely useful reframing: a vague fear becomes a specific, checkable number. In HFmrEF/HFpEF, SGLT2i+sMRA produced systolic blood pressure −5.9 mmHg (−7.3 to −4.6), eGFR −7.7 (−8.9 to −6.4), and potassium +0.34 (0.29 to 0.38); SGLT2i+nsMRA produced −4.8 (−5.7 to −4.0), −6.1 (−6.7 to −5.5), and +0.21 (0.18 to 0.25) — all reported as 95% prediction intervals.
Why “prediction interval” is not a footnote here
A confidence interval answers: where does the true average effect sit? A prediction interval, as used in this kind of pooled meta-analysis, answers a related but different question: if you ran this in a new population, where would that population’s true average effect likely fall? Because it has to account for how much the nine underlying trials disagreed with each other, a prediction interval is wider than a confidence interval built from the same data — not narrower, and not a tighter statement about any one patient. The abstract itself uses the term “prediction intervals” explicitly, not “confidence intervals” — a distinction that is easy to blur when reading quickly, and blurring it changes what the calculator can honestly be said to do. Read correctly, hfmodel.org tells a clinician: patients who look like yours, on average, moved this much. It does not tell a clinician: your specific patient has a 95% chance of landing in this range. The gap between those two statements is exactly where the events that actually stop a prescription — potassium at or above 5.5, a steep eGFR drop, symptomatic hypotension — are hiding, in the tail the average does not describe.
What this paper actually adds for practice
The genuinely new, checkable number here is the nsMRA-versus-sMRA contrast within HFmrEF/HFpEF: potassium rose less with nonsteroidal MRA (+0.21) than with steroidal MRA (+0.34), and the two prediction intervals do not overlap. eGFR decline was also smaller with nsMRA (−6.1 vs. −7.7). That is real signal, drawn from the paper’s own reported numbers — but it compares two different trials’ arms against two different placebo groups, not a randomized head-to-head, and it says nothing about hyperkalemia-related discontinuations or hospitalizations, only about the average lab-value trajectory. And this contrast is only reported for the HFmrEF/HFpEF stratum; the HFrEF combination shown in the top panel above did not have a separate nsMRA arm reported in the abstract.
One more point belongs in the same breath as everything above. A companion piece published in the same cycle looks at the opposite version of this problem in a different cardiology paper: a trial that missed statistical significance carrying almost the same effect size as one that met it. Both pieces are about numbers that mean less, or something different, than the headline verdict built on top of them — but each stands on its own.
Deep dive
1. Background
Modern heart-failure guidance increasingly pushes toward starting several drug classes together, quickly, rather than sequentially titrating one at a time — the 2026 ESC heart failure guideline, published three days before this paper (August 28, 2026, versus August 31), explicitly frames foundational therapy as four pillars (beta-blocker, ACEi/ARNI/ARB, MRA, SGLT2 inhibitor) to be started within about four weeks, and reclassifies ejection-fraction categories, retiring the HFmrEF label in favor of a two-way HFrEF (below 50%)/HFpEF (50% and above) split. The clinical friction against that push is well documented: hypotension, worsening renal function, and hyperkalemia are the most commonly cited reasons clinicians delay or avoid comprehensive therapy. This paper’s stated aim is to convert that friction into checkable numbers by pooling patient-level data across large randomized trials and packaging the estimates into a public calculator.
2. What this study newly shows
The authors pooled individual-participant data from 9 randomized trials totaling 38,753 patients (16,877 HFrEF, 21,876 HFmrEF/HFpEF) and built a prediction model spanning four drug classes — ARNI, steroidal MRA, nonsteroidal MRA, and SGLT2 inhibitors — and four outcome measures (systolic and diastolic blood pressure, eGFR, serum potassium) over a 2–12 week short-term window. For HFrEF, the reported combination is ARNI+SGLT2i+sMRA: SBP −9.2 mmHg (95% PI −10.6 to −7.8), eGFR −6.8 (−7.9 to −5.4), potassium +0.30 (0.25 to 0.35). For HFmrEF/HFpEF, two combinations are reported: SGLT2i+sMRA (SBP −5.9, eGFR −7.7, potassium +0.34) and SGLT2i+nsMRA (SBP −4.8, eGFR −6.1, potassium +0.21). All intervals are explicitly labeled 95% prediction intervals in the abstract text, not confidence intervals. External validation in an additional 4 trials, 1,016 patients, is reported by the authors (via press materials) as showing estimated effects consistent with observed values; quantitative performance metrics for that validation were not available to us.
3. Methodological strengths and limits
Strengths. This is the largest heart-failure individual-participant-data pool we are aware of for this specific question, published peer-reviewed in Nature Medicine, explicitly labeling its uncertainty intervals as prediction intervals rather than confidence intervals (a distinction many pooled analyses blur), and translated into a free, publicly accessible calculator rather than left in a paywalled paper. The paper’s authorship includes several of the most prominent trialists in the underlying heart-failure RCT literature, which is both a strength (deep familiarity with the source trials) and a structural fact worth naming (see Disclosure below).
Limits. This is an estimate of laboratory and vital-sign change, not an outcomes study; death, hospitalization, dialysis initiation, and severe hyperkalemia are not modeled. We could not confirm from the abstract alone exactly what statistical entity the reported prediction interval represents — between-trial heterogeneity in a new population’s average effect is the standard IPD meta-analysis usage, and is the reading this piece uses throughout, but the full paper’s methods were not accessible to us to confirm it directly. Beta-blockers, loop diuretics, and ACE inhibitor/ARB-only regimens — all common in practice — are not among the model’s drug classes; this is a fact about what the model covers, not a claim about how much any omitted drug would change the reported numbers. Randomized trials are known to under-enroll patients with hypotension, advanced chronic kidney disease, or elevated potassium at baseline — precisely the population this calculator is meant to reassure clinicians about treating — so patients furthest from the trial population are likely least represented in the training data, and it is unconfirmed whether the reported intervals widen appropriately for such patients. The roster of the nine underlying trials is not disclosed in the abstract, which limits our ability to assess heterogeneity across eras of background therapy. External validation covers only about 2.6% of the training sample, and its quantitative performance was not independently confirmed by us.
4. Connections to neighboring domains
This paper sits at one end of a chain this outlet has separately tracked at its other end: a clinical decision-support tool built and deployed is stage one; whether clinicians actually use it, whether that changes prescribing, and whether that changes outcomes are three further, separate stages, each requiring its own evidence. A previous analysis this outlet published documented a deployed clinical decision-support tool whose adoption by physicians collapsed within four weeks of rollout, from roughly two-thirds usage down to about 30% — a case study in exactly the gap between “built” and “used.” This paper is the mirror image: a tool has just been built and deployed, and none of the downstream evidence yet exists. Neither observation says anything about whether this particular calculator will follow that pattern; it is a reason for calibrated expectations, not a prediction.
A second connection is to nephrology guideline timing: the 2026 ESC heart failure guideline retired the HFmrEF category three days before this paper was published, collapsing ejection fraction into a two-way HFrEF/HFpEF split. This paper still stratifies by the old three-way HFrEF/HFmrEF/HFpEF framework, and its drug-combination lists differ between the HFrEF and HFmrEF/HFpEF strata — meaning a patient with an ejection fraction of, say, 45% is classified as HFrEF under the new guideline but would be modeled under the calculator’s HFmrEF/HFpEF arm, which uses a different drug-combination list. Whether the tool’s interface actually reflects this boundary correctly is something we could not confirm; the underlying Shiny application renders through JavaScript and was not fully inspectable by us.
5. Commercialization and investment angle
This paper evaluates no brand and compares no company’s product against another’s. The table below is a factual map, kept separate from the paper’s own scientific claims.
| Layer | Facts (sourced) |
|---|---|
| ARNI | Sacubitril/valsartan (Novartis) is the only marketed drug in this class. This is a drug-class-level estimate, not a brand evaluation. |
| SGLT2 inhibitors | Dapagliflozin (AstraZeneca), empagliflozin (Boehringer Ingelheim/Eli Lilly). No product-versus-product comparison is made. |
| Steroidal MRA (sMRA) | Spironolactone, eplerenone — widely available generics. The combination carrying the largest potassium rise in this analysis. |
| Nonsteroidal MRA (nsMRA) | Finerenone (Bayer) is the only nonsteroidal MRA with large-scale heart-failure RCT data that we are aware of, though the specific trials pooled in this paper’s nsMRA arm are not disclosed in the abstract, so we do not equate the two directly. In the HFmrEF/HFpEF stratum, this arm showed a smaller potassium rise and smaller eGFR decline than the sMRA arm — not an outcomes comparison, not head-to-head. |
| Tool layer | hfmodel.org, developed at The George Institute for Global Health and Harvard Medical School. Free and publicly accessible. No commercial sponsor was disclosed on the site as reviewed. |
| Potassium binders (patiromer, sodium zirconium cyclosilicate) | Not mentioned anywhere in this paper. The finding that potassium rises by only about 0.3 mmol/L on average could be read as a mild headwind to the case for routine potassium-binder co-prescription — but this is this outlet’s own observation, not a claim the paper makes, and it does not address individual-patient tail risk, where binders are more likely to be clinically relevant. |
TRL, with layers kept separate. As a deployed software tool, the calculator sits at TRL 6 — a working prototype, developed on a large IPD base and externally validated in a smaller cohort, publicly accessible today, but with no evidence yet of use within a real clinical workflow. As a driver of clinical behavior change or improved outcomes, the evidence sits at TRL 3 — a concept with no prospective evaluation yet. The underlying drug classes themselves are all separately TRL 9 (approved, marketed therapies); that maturity belongs to the drugs’ efficacy indications, not to this combination-safety prediction tool, and conflating the two is the most likely misreading of this paper.
6. The counter-view
This outlet’s independent review verified the paper’s headline figures verbatim against the original abstract and required the following caveat to be carried into any published summary, reproduced here in full:
This study pools individual-level data from 9 randomized trials, 38,753 patients, to estimate how heart-failure combination therapy moves blood pressure, eGFR, and serum potassium in the short term (2–12 weeks), and packages the results into a free web calculator. This is not an outcomes trial — death, hospitalization, dialysis, and severe hyperkalemia were not estimated. The ranges the abstract reports are not confidence intervals but 95% prediction intervals, which describe the range within which the true effect in a new population would fall, given how much the underlying trials differed from each other — not an individual patient’s likely range of change. The potassium interval’s width (for example, 0.25–0.35 mmol/L) is narrower than the potassium fluctuation seen from repeated measurement within a single person, so it almost certainly cannot describe an individual-level distribution; the calculator therefore outputs something closer to “the average change among patients who share your patient’s characteristics,” not “the probability your specific patient develops hyperkalemia.” The point where clinicians actually stop a prescription — potassium at or above 5.5, symptomatic hypotension — sits in the tail of a distribution, not at the mean. The model’s drug classes are limited to ARNI, steroidal MRA, nonsteroidal MRA, and SGLT2 inhibitors; beta-blockers, loop diuretics, and ACE inhibitor/ARB-only regimens are not included. Randomized trials exclude patients with hypotension, advanced kidney disease, and elevated potassium at enrollment — exactly the population this tool aims to describe — so the patients who most need this calculator are likely the least represented in its training data. The comparison between nonsteroidal and steroidal MRA is not head-to-head and not an outcomes comparison. The calculator is live today, but there is no evidence yet that it changes prescribing rates or patient outcomes. We have not accessed the full paper, and the authors’ competing-interest disclosures were not independently confirmed. This is for informational purposes only and does not constitute investment or medical advice.
Two further points bear on how much weight this tool can carry today. First, the beta-blocker omission is a fact about the model’s covered drug classes, not evidence that real-world blood-pressure burden is systematically worse than reported — most trial participants were likely already on background beta-blocker therapy even though it is not modeled as a combination arm, and how that background therapy interacts with the modeled combinations is simply not addressed by the published abstract. Second, the paper’s own stated conclusion is a neutral one — that it “provides individualized estimates of the expected treatment effect” — and any reading of this paper as concluding that the overall burden of combination therapy is smaller than feared is this outlet’s own synthesis of the reported numbers, not a claim the authors make directly.
7. Metrics to watch
- Whether the full paper’s Methods section confirms that the reported prediction interval reflects between-trial heterogeneity (as this piece assumes) rather than some other statistical construct — the single most consequential unresolved detail for how this tool should be read.
- Whether hfmodel.org’s user interface clearly labels its output as a population-average estimate rather than an individual-risk probability, and whether it correctly routes patients with an ejection fraction of 41–49% given the new ESC guideline’s reclassification.
- Any prospective study of whether calculator use changes four-drug initiation rates, discontinuation rates, or hard outcomes — none of which exists yet.
- Peer-reviewed, rather than press-release-sourced, detail on the nine pooled trials’ identities and the underlying nonsteroidal-MRA trial roster.
- Whether future analyses extend this model to include beta-blockers, loop diuretics, and longer-term (post-12-week) trajectories, including the known partial recovery of the initial eGFR “dip” seen with SGLT2 inhibitors and MRAs over longer follow-up.
References
- Wang, Nelson, Brian L. Claggett, Marc A. Pfeffer, João Pedro Ferreira, Faiez Zannad, Bertram Pitt, Milton Packer, Kieran F. Docherty, John J. V. McMurray, Scott D. Solomon, and Muthiah Vaduganathan. 2026. “Short-Term Effects of Combinations of Heart Failure Therapies on Blood Pressure, Kidney Function and Serum Potassium.” Nature Medicine, published August 31, 2026. DOI: 10.1038/s41591-026-04623-z. Paywalled; this piece is sourced from the publisher-deposited structured abstract, independently verified verbatim, not the full text.
- Heart Failure Treatment Effect Calculator. hfmodel.org (embedded application at dream-bp-model.shinyapps.io/HF-model/). The George Institute for Global Health and Harvard Medical School. Existence, attribution, and stated purpose independently verified via direct inspection of the site’s HTML; the underlying application’s interface renders via JavaScript and was not independently inspected for this piece.
- The George Institute for Global Health. 2026. Press release accompanying the above study, redistributed via EurekAlert and MedicalXpress, August 31, 2026. Source for model input variables, external validation sample size, and first-author fellowship funding disclosures cited in this piece; not independently confirmed against the paper’s full text.
- European Society of Cardiology. 2026. “2026 ESC Guidelines for the Management of Heart Failure.” European Heart Journal, advance article, published August 28, 2026. DOI: 10.1093/eurheartj/ehag100. Cited here for the HFmrEF reclassification and four-pillar foundational-therapy framing via secondary reporting (ESC press materials); the full guideline text was not independently reviewed for this piece.
- This outlet’s earlier coverage of a deployed clinical decision-support tool’s adoption collapse in an emergency-department setting, cited above for the “built versus used” comparison; details of that trial are available in this outlet’s prior publication on the topic.
Disclosure
This piece is for information purposes only. It does not constitute investment advice, and it does not constitute medical advice — nothing here should be used to make, or change, any heart-failure treatment decision. Readers with questions about heart-failure management should consult their own clinician.
The author discloses no position in any entity mentioned in this piece.
COI note. This piece could not access the paper’s full Competing Interests and Funding disclosures, which are behind a paywall; this is a limitation of our access, not an assertion that no disclosures exist. Per a press release accompanying the paper, the first author reported fellowship support including a Novo Nordisk Cardiometabolic Fellowship, and multiple co-authors were described as having broader pharmaceutical-industry relationships not itemized in that press release; we could not independently confirm the individual disclosure details. Several co-authors of this paper — a group that includes some of the most prominent trialists in the underlying heart-failure RCT literature — are, as a structural fact, closely associated with the design and conduct of the very trials whose data were pooled here; this overlap is also a practical precondition for accessing individual-participant-level data of this kind, and we record it neutrally rather than as an allegation. The calculator described in this piece (hfmodel.org) is free and publicly accessible; no commercial sponsor was identified in our review of the site. This piece names several drug classes and their manufacturers (Novartis, AstraZeneca, Boehringer Ingelheim, Eli Lilly, Bayer) and separately discusses potassium-binder manufacturers as a category; the underlying paper evaluates none of these companies’ specific products against one another, and this piece renders no positive or negative investment judgment on any of them. Any quantitative claim attributed to the paper’s authors in this piece should be read as their own reported results, not independently re-derived by this outlet.
 Uthando Nethemba
Leave a comment