Evidence-first notes on bioscience and deep tech, at the edge of the lab and the market. Information only — not investment advice, and not medical advice.
The 30-second version
- What. The causal case for lipoprotein(a), Lp(a), as a driver of atherosclerotic cardiovascular disease is one of the strongest genetic cases in cardiology — Mendelian randomization (MR) removes most of the confounding and reverse-causation worries of observational data, and the causal spectrum extends all the way to aortic stenosis. But the effect is weak per unit: genetically, lowering Lp(a) by 1 mg/dL is worth only about 0.38 times a 1 mg/dL LDL-C reduction, so matching the roughly 20% relative risk reduction of a 38.67 mg/dL (1 mmol/L) LDL drop would require lowering Lp(a) by about 101.5 mg/dL. (MR estimate, Burgess et al. 2018.)
- So what. The commonly quoted “thresholds” (for example ≥70 mg/dL, ≥125 nmol/L) are not a biological threshold: MR and large cohorts (UK Biobank) both show the dose-response is continuous and linear with no threshold — those cutoffs are practical trial-enrolment lines and risk flags, not a point where risk switches on. Keep MR (genetic, causal) separate from observational association, and both separate from randomized outcomes.
- Now what. Guidelines have advanced fast on measurement and not at all on treatment targets: the 2026 ACC/AHA multi-society guideline moves to universal measurement in all adults (a first for a US guideline, framed toward Class I) and names Lp(a) an ASCVD causal factor independent of LDL-C — yet sets no treatment target and no lowering recommendation, because hard-outcome randomized trials are not yet read out. Causality accepted; treatment awaits outcomes. The metric to watch is whether the ongoing outcome trials show benefit scaling with absolute lowering toward that ~101.5 mg/dL arithmetic.
The five-minute read
The question is not “is Lp(a) causal,” but “how much must you lower it, and has anyone shown lowering helps?”
From a cardio-kidney-metabolic (CKM) perspective, Lp(a) is the genetically fixed axis of residual risk: even after statins, PCSK9 inhibitors, SGLT2 inhibitors, GLP-1 agents and blood-pressure control push metabolic, inflammatory and LDL risk to the floor, part of what remains is attributable to Lp(a). MR has established that attribution as causal, and the causal spectrum reaches aortic valve calcification as well as coronary disease. Two gaps remain. First, an efficiency gap: the causal effect is real but weak per unit, so meaningful clinical benefit requires large absolute lowering. Second, a translation gap: MR measures lifelong exposure, and there is no guarantee that a few years of pharmacological lowering in late adulthood reproduces the same slope. Those two gaps are exactly why guidelines have advanced on measurement while withholding any treatment target. (MR and epidemiology here are mostly non-industry academic cohorts; the efficiency-gap arithmetic is separately re-cited as pipeline rationale by sponsors — noted neutrally.)
Keep genetic causation, observational association and randomized outcomes separate
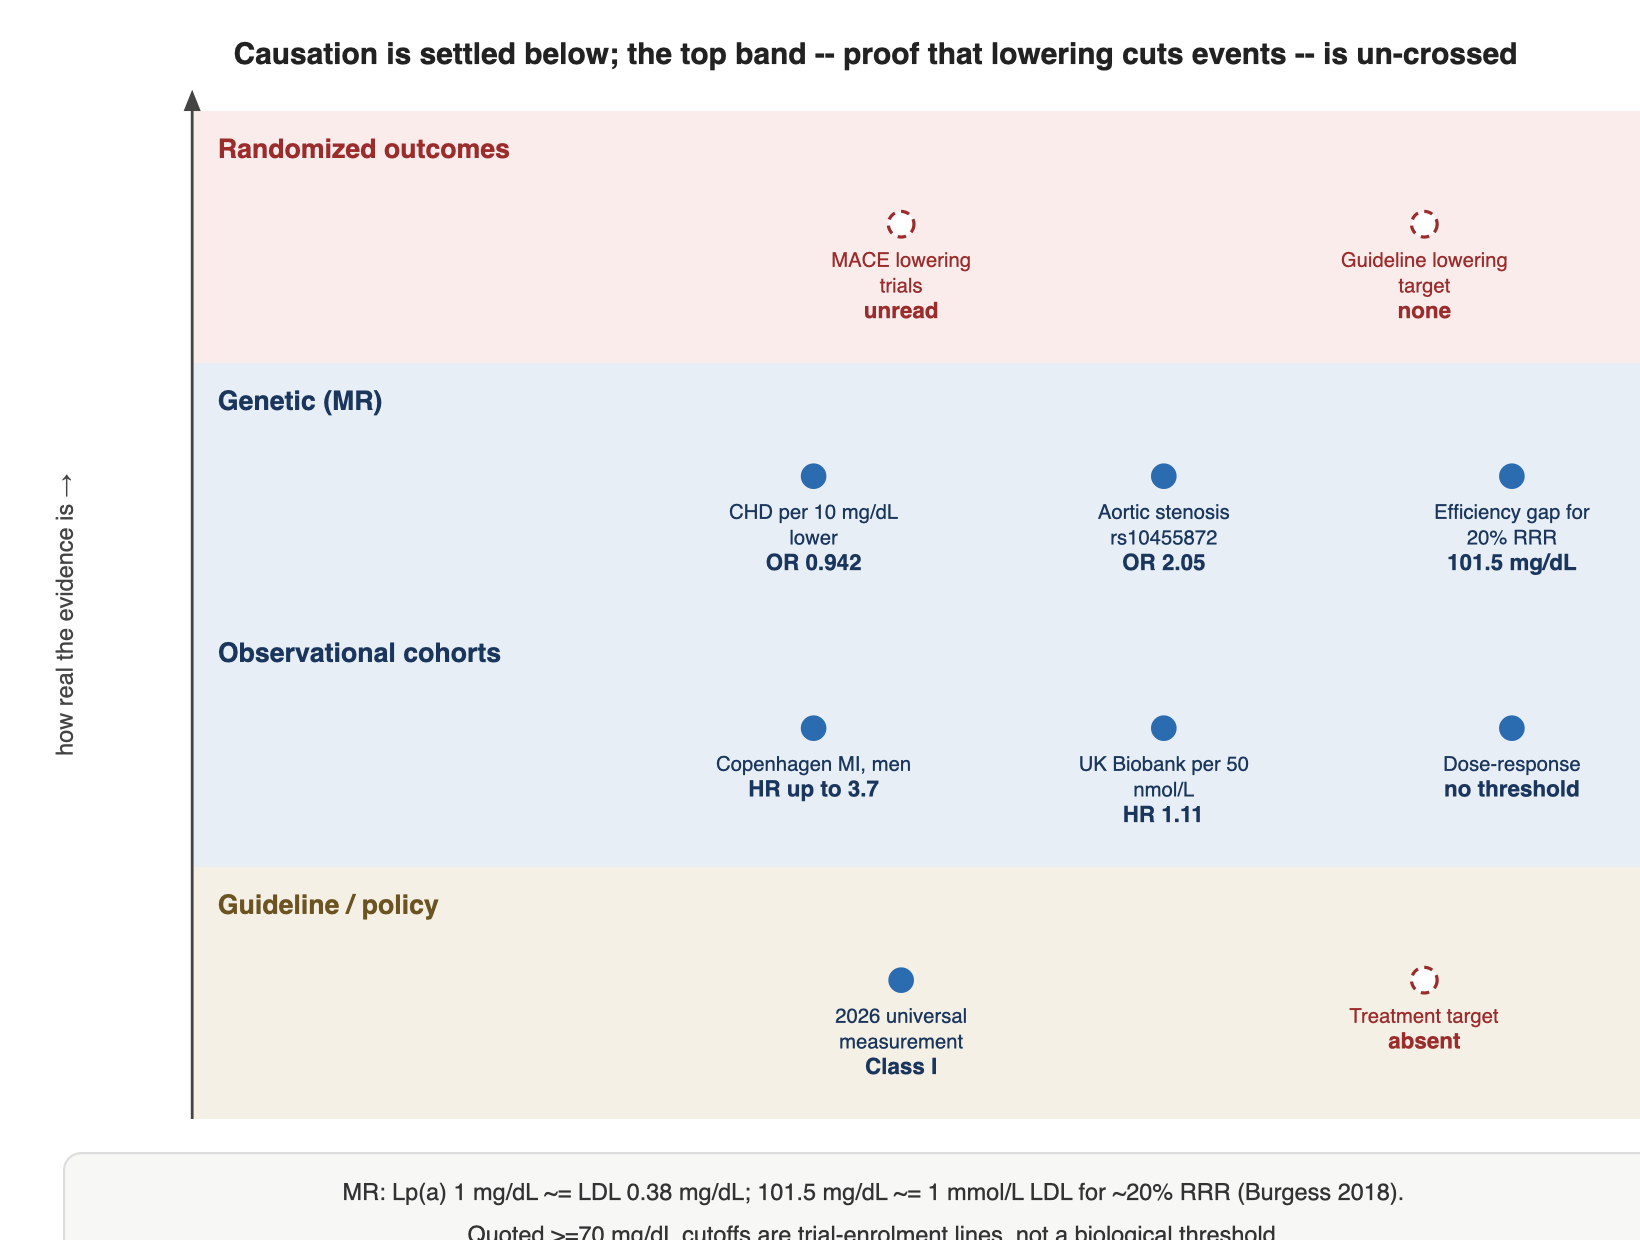
MR sets the direction of causation because LPA genotype is randomized at conception and fixed for life, insulating it from lifestyle, reverse causation and acquired confounding. Burgess et al. (JAMA Cardiology 2018) reported that a genetically 10 mg/dL lower Lp(a) corresponds to coronary heart disease OR 0.942 (95% CI 0.933–0.951), about a 5.8% risk reduction, versus OR 0.855 (0.818–0.893, ~14.5%) for a 10 mg/dL lower LDL-C. Large cohorts then fill in the shape and the absolute risk: the Copenhagen City Heart Study (Circulation 2008) showed a monotonic, threshold-free rise in myocardial-infarction risk across Lp(a) percentiles in both sexes, and UK Biobank (cited in the EAS 2022 consensus, EHJ 43:3925) confirmed a continuous relationship with no threshold. What none of these establish is that lowering Lp(a) with a drug prevents events — that is the randomized-outcome layer, still unread.
| Claim | Evidence type | Key figure (attributed) | Strength |
|---|---|---|---|
| Lp(a) → ASCVD is causal | Genetic (MR) | CHD OR 0.942 per 10 mg/dL lower (Burgess 2018) | Established (step-change genetic case) |
| Lp(a) → aortic stenosis is causal | Genetic (MR) | rs10455872 OR 2.05, P=9.0×10⁻¹⁰ (NEJM 2011) | Established |
| Dose-response is continuous, no threshold | Genetic + observational | Copenhagen monotonic HR; UK Biobank continuous (EAS 2022) | Established |
| Efficiency gap (weak per unit) | Genetic (MR extrapolation) | Lp(a) 101.5 mg/dL ≈ LDL 38.67 mg/dL for ~20% RRR | Established as MR estimate (not a constant) |
| “Much lowering needed” → 90%+ reduction rationale | Arithmetic from efficiency gap | 101.5 mg/dL from baseline 100–150 mg/dL | Strong inference (re-cited as pipeline rationale) |
| Guideline measurement recommendation | Consensus / policy | 2018 selective → 2026 universal (Class I-directed) | Established · advancing |
| Lowering Lp(a) → fewer events (MACE) | Randomized outcomes | Trials unread (HORIZON / OCEAN(a) / ACCLAIM) | Not demonstrated — the boundary of this piece |
| Guideline treatment target | Consensus / policy | No lowering target in any guideline | Absent (the gap itself is established) |
The efficiency gap, quantified — and why it becomes a pipeline argument
On a genetic-score basis, lowering Lp(a) by 1 mg/dL carries roughly 0.38 times the coronary risk effect of lowering LDL-C by 1 mg/dL. Scaled up, matching the ~20% relative risk reduction of a 38.67 mg/dL (1 mmol/L) LDL drop would require lowering Lp(a) by about 101.5 mg/dL. As TCTMD summarized the 2018 analysis (quotation ≤150 characters): “an absolute reduction of 101.5 mg/dL in Lp(a) would be required to have roughly the same 20% relative reduction… as a 38.67 mg/dL drop in LDL cholesterol.” The practical consequence is arithmetic, not biology: to secure ~101.5 mg/dL of absolute lowering from a baseline of 100–150 mg/dL, you need a large absolute drop, which implies 90%+ relative lowering — the design target of the siRNA/ASO agents. That this arithmetic is re-cited to justify listed-pharma pipeline potency targets is recorded here neutrally, not endorsed.
Deep dive
1. Background
Lp(a) is an LDL-like particle carrying apolipoprotein(a), whose plasma concentration is roughly 70–90% genetically determined by the LPA gene, largely through the KIV-2 copy-number repeat. Because that genotype is fixed at conception, Lp(a) is effectively a lifelong, non-modifiable-by-lifestyle exposure — which is precisely what makes it tractable for Mendelian randomization and what makes it the “genetically fixed axis” of CKM residual risk. This part dissects only the causal layer: how far MR has established causation, the shape of the dose-response, and how that causation has (and has not) been translated into guidelines. The lowering-agent pipeline and the outcome trials are deferred to later parts. Every efficacy figure is attributed to the cited study.
2. What the evidence newly establishes
- MR — causation, dose-response, efficiency gap: Burgess et al. (JAMA Cardiology 2018) established the causal direction (CHD OR 0.942 per 10 mg/dL lower Lp(a)), a linear relationship proportional to absolute lowering with no threshold, and the efficiency gap (Lp(a) 1 mg/dL ≈ LDL 0.38 mg/dL; 101.5 mg/dL ≈ a 1 mmol/L LDL drop for ~20% RRR). The clinical implication is that benefit is governed by slope, not threshold — so it grows with higher baseline and larger absolute lowering, which is the genetic justification for outcome trials selecting high-baseline patients and targeting large absolute reductions.
- Epidemiology — dose-response, the “threshold” reality, and the valve: The Copenhagen City Heart Study (Circulation 2008; n = 9,330, 10-year follow-up, 498 MIs) showed monotonic MI hazard ratios by percentile band (versus <5 mg/dL): women 1.1 / 1.7 / 2.6 / 3.6 and men 1.5 / 1.6 / 2.6 / 3.7 up to ≥120 mg/dL. In a high-risk background, 10-year absolute MI risk widened from ~10% to ~20% (women) and ~19% to ~35% (men). The EAS 2022 consensus, citing UK Biobank (median follow-up 11.2 years), reported a continuous, threshold-free Lp(a)–ASCVD relationship (HR 1.11 / 1.10 / 1.07 per 50 nmol/L increase in White / South Asian / Black participants), confirming that cutoffs like ≥70 mg/dL are enrolment lines and risk flags, not biological thresholds.
- Extension to the valve: The rs10455872-G LPA variant is associated genome-wide with aortic valve calcification (OR 2.05, P = 9.0×10⁻¹⁰; Thanassoulis et al., NEJM 2011), and genetically determined Lp(a) raises valve-calcification odds by about 62% per log unit. A Copenhagen analysis of 100,578 individuals found elevated Lp(a) causally raises both MI and aortic stenosis but does not act through low-grade inflammation (PubMed 25938632) — a distinct valve pathway. Implication: an Lp(a)-lowering drug could in theory target both ASCVD and aortic stenosis, but no outcome trial uses aortic stenosis as a primary endpoint, so the causal claim there is even further from treatment proof.
3. Methodological strengths and limits
- Strengths: LPA is a relatively “clean” instrument — genotype randomized at conception, minimal pleiotropy relative to many exposures — and the MR direction, the observational dose-response and the aortic-valve genetics cross-support one another. The threshold-free finding is consistent between genetic and observational data.
- Limit 1 — MR instrument assumptions: MR rests on relevance, independence and the exclusion restriction. If LPA variants affect coronary disease through paths other than Lp(a) (pleiotropy), the estimate is biased. LPA is judged relatively clean, but KIV-2 copy-number variation and linkage disequilibrium remain residual concerns.
- Limit 2 — KIV-2 measurement noise: Isoform size affects both the instrument and the exposure measurement, so the MR slope itself is sensitive to assay and units (mg/dL versus nmol/L). The 101.5 mg/dL figure is therefore an estimate, not a constant.
- Limit 3 — efficiency gap is arithmetic, not a guarantee: “Lower by 101.5 mg/dL for 20% RRR” is an MR extrapolation. Whether a randomized trial reproduces that slope with late-adulthood intervention is untested.
- Limit 4 — exposure-duration asymmetry (the translation gap): MR captures decades of lifelong exposure; a few years of pharmacological lowering acts on already-formed plaque and calcified valves, so the achievable effect magnitude could be smaller than the MR slope implies.
4. Neighbouring domains
Two cross-domain hooks matter. First, causal inference: the MR instrumental-variable assumptions (relevance, independence, exclusion restriction) are the same statistical frame shared by causal machine learning and counterfactual inference — MR is, in effect, a natural-experiment version of the same problem. Second, genomics: KIV-2 copy-number variation is a noise source for the MR instrument, so optical mapping and long-read sequencing that quantify KIV-2 more precisely directly bound the precision of the causal estimate and of the ~101.5 mg/dL figure. In the CKM frame specifically, Lp(a) is the genetically fixed residual-risk axis that persists after SGLT2 inhibitors, GLP-1 agents, finerenone, statins and PCSK9 inhibitors have done their work — a cross-domain, not head-to-head, reading.
5. Commercialization and market context (TRL, companies)
- TRL — split by layer: For the causal evidence itself, TRL is not applicable (it is a maturity scale for technology, not for causal knowledge). But the diagnostic (measurement) layer has reached TRL 9 (routine clinical use) with the 2026 universal-measurement adoption. The scientific bottleneck is not lowering magnitude (already achievable, the class sits at roughly TRL 7 per the series map) but outcome demonstration.
- Listed and private companies: The lowering pipeline referenced by the efficiency-gap arithmetic includes Novartis (pelacarsen), Amgen (AMGN; olpasiran), Eli Lilly (LLY; lepodisiran), Silence Therapeutics (zerlasiran) and Ionis. These agents and their sponsor-supported trials are described in later parts; here they are named only to note that the “90%+ lowering” target maps onto the 101.5 mg/dL arithmetic, and that this mapping is a sponsor-cited rationale, recorded neutrally.
- Guideline-market read: The 2026 ACC/AHA move to universal measurement has obvious implications for the Lp(a) diagnostic-testing market and could be misread as a treatment-market signal. It is not: no guideline sets a lowering target.
- The exact Class/Level wording and specific cutoff numbers in the final 2026 ACC/AHA text (only “universal, Class I-directed” is confirmed); and whether Korea’s KSoLA dyslipidemia guideline has adopted universal Lp(a) measurement and with what cutoff — both isolated as unverified, to be confirmed from primary text.
6. The skeptic’s counterpoint
Mandatory caveats inherited from the original deep-dive’s skeptic gate (§6, proceed-with-caveats):
- The causal layer is verified-clean; the treatment layer is not. Causation, dose-response and measurement recommendations are verified-clean. But “pharmacological lowering reduces events” is not yet demonstrated — this piece is clean only up to the causal layer; treatment utility is the boundary and belongs to the outcome trials (HORIZON / OCEAN(a) / ACCLAIM).
- The efficiency gap is arithmetic, not a warranty. The 101.5 mg/dL figure is an MR extrapolation and is sensitive to assay, units and KIV-2 measurement noise; it is an estimate, not a constant.
- The “threshold” is not biological. MR and UK Biobank both show a continuous, threshold-free relationship; ≥70 mg/dL and similar are practical enrolment/risk cutoffs, and risk is already elevated below them.
- Guideline caution is itself a signal. That every guideline deliberately withholds a treatment target despite strong causation means the expert consensus acknowledges the translation gap. Do not read the 2026 universal-measurement move as an imminent treatment recommendation.
- Surrogate history warns against auto-translation. Lp(a) lowering is a biomarker change; the niacin and CETP-inhibitor histories show that a favourable lipid biomarker does not automatically translate into fewer events, and can even harm. 90% lowering does not by itself mean MACE reduction.
- COI / attribution. The MR and epidemiology cohorts are mostly non-industry academic data, but the efficiency-gap interpretation is re-cited as pipeline rationale by listed sponsors; that re-use is recorded neutrally, and quantitative claims are attributed to the vendor / author / study as appropriate.
- Falsifiable predictions. (1) Outcome benefit will scale with absolute lowering (approaching ~101.5 mg/dL) and baseline; if low-baseline / small-lowering subgroups show undiminished benefit, the efficiency-gap logic is challenged. (2) Aortic-stenosis outcomes will improve later or more weakly than ASCVD (late intervention struggles to reverse existing calcification). (3) No guideline will codify a lowering target before the first positive outcome readout; a pre-outcome Class II-or-higher target would break this prediction.
7. What to watch
- Whether the ongoing outcome trials (HORIZON / OCEAN(a) / ACCLAIM) show event reduction scaling with absolute Lp(a) lowering toward the ~101.5 mg/dL arithmetic, and whether low-baseline subgroups benefit.
- The final 2026 ACC/AHA text — exact Class/Level and cutoff wording for Lp(a) measurement.
- Whether any guideline codifies an Lp(a) lowering target (the first would come only after a positive outcome readout).
- Aortic-stenosis endpoints, which no trial currently sets as primary — causal but furthest from treatment proof.
- KIV-2 quantification advances (long-read / optical mapping) that could tighten the MR slope and the 101.5 mg/dL estimate.
References
- Burgess S, et al. Association of LPA variants with risk of coronary disease and the implications for lipid-lowering therapies (Mendelian randomization). JAMA Cardiology. 2018. https://pubmed.ncbi.nlm.nih.gov/29926099/ (summary: https://www.tctmd.com/news/clinical-benefit-lowering-lpa-proportional-its-absolute-reduction-mendelian-randomization)
- Kamstrup PR, et al. Extreme lipoprotein(a) levels and risk of myocardial infarction in the general population (Copenhagen City Heart Study). Circulation. 2008. https://www.ahajournals.org/doi/10.1161/circulationaha.107.715698
- Kronenberg F, et al. Lipoprotein(a) in atherosclerotic cardiovascular disease and aortic stenosis: EAS consensus statement (UK Biobank data cited). European Heart Journal. 2022;43(39):3925. https://academic.oup.com/eurheartj/article/43/39/3925/6670882
- Thanassoulis G, et al. Genetic associations with valvular calcification and aortic stenosis (rs10455872 / LPA). New England Journal of Medicine. 2011. https://www.nejm.org/doi/full/10.1056/NEJMoa1109034
- Langsted A, et al. Elevated lipoprotein(a) causally associated with myocardial infarction and aortic stenosis, not via low-grade inflammation (Copenhagen, n=100,578). 2015. https://pubmed.ncbi.nlm.nih.gov/25938632/
- National Lipid Association. 2026 ACC/AHA multi-society dyslipidemia guideline released (universal Lp(a) measurement). 2026. https://www.lipid.org/nla/2026-accahamultisociety-dyslipidemia-guideline-released
- Roche Diagnostics / ESC-EAS. Guidelines on Lp(a) and cardiovascular disease. https://diagnostics.roche.com/global/en/cardialogue/article/esc-eas-guidelines-lpa-cvd.html
Note: individual DOIs/URLs and publication dates should be confirmed against the primary sources. Copyrighted full text from Nature/NEJM and similar is not redistributed; only summary, commentary and quotations ≤ 150 characters are included.
Disclosure
This post is for information only. It is not investment advice, and it is not medical advice — treatment decisions must be made in consultation with a qualified healthcare professional. The author holds no position in the named securities (AMGN, LLY, and listed shares of Novartis, Silence Therapeutics, Ionis).
COI note: the Mendelian randomization and epidemiology cited here (Burgess 2018, Copenhagen City Heart Study, UK Biobank via the EAS 2022 consensus, Thanassoulis 2011) are largely non-industry academic cohorts. However, the efficiency-gap arithmetic (Lp(a) 101.5 mg/dL ≈ LDL 38.67 mg/dL for ~20% relative risk reduction; Lp(a) 1 mg/dL ≈ LDL 0.38 mg/dL) is re-cited by listed sponsors (Novartis, Amgen, Eli Lilly, Silence Therapeutics, Ionis) as rationale for 90%+ lowering pipelines; that re-use is recorded neutrally, and quantitative claims are attributed to the respective studies as MR / author / vendor estimates. This piece separates genetic causation (established) from observational association and from as-yet-unconfirmed randomized outcomes, and does not recommend any manufacturer or drug.


Leave a Reply