Evidence-first notes on bioscience and deep tech, at the edge of the lab and the market. Information only — not investment advice. There is no operating fusion power plant anywhere in the world, so no measured LCOE, capex or availability exists; every economic figure in this post is a model or an estimate, attributed to its source. Company roadmaps and power-purchase agreements are separated from operating plants (a PPA or a grid-interconnection application is not delivered power). Market-size projections are flagged, not cited, because they are internally inconsistent.
The 30-second version
- What. The commercial story is led by “2030s grid” roadmaps: Helion signed the world’s first fusion power-purchase agreement (PPA) with Microsoft targeting 50 MW in 2028 (Orion plant, Chelan County WA; Constellation as power marketer; a real PPA with financial penalties for non-delivery), and Commonwealth Fusion Systems (CFS) has applied to PJM interconnection for its ~400 MWe ARC plant in Virginia (the first fusion company to do so). These roadmaps and PPAs are real, but they are not operating plants — a signed PPA and a grid-interconnection application are not delivered electricity.
- So what. The commercial bottleneck is timeline and economics, not science. Levelized cost of electricity (LCOE) is a function of capex, tritium fuel, neutron-durable materials, availability (duty cycle) and O&M — and an ignition milestone (NIF’s Qplasma>1) is orthogonal to that stack: it raises the numerator (fusion energy) but touches none of the denominator. Scientific milestone ≠ lower LCOE. Because no plant operates, no measured LCOE exists — every figure is modeled, and an independent (non-company) model itself calls its own mature-plant $110–144/MWh “rather optimistic.”
- Now what. The decisive benchmark is the higher-TRL neighbor, fission SMR: NuScale/UAMPS’ first-of-a-kind project saw its target price rise $55→$89/MWh and overnight cost $9,964→$21,561/kW before being cancelled in November 2023 — reconfirming “always 30 years away” on the economics axis for a technology that is already proven. Fusion has not yet reached that first-of-a-kind gate. And vendor “fusion market-size” projections are internally inconsistent (2030 estimates exceed 2035 estimates) and should not be cited as a single figure.
The five-minute read
The roadmaps are real — but a PPA is not an operating plant
The commercial narrative is led by concrete-sounding dates. Helion signed the world’s first fusion PPA with Microsoft in May 2023, targeting 50 MW of delivered power in 2028 (after a one-year ramp), with the Orion plant under construction in Chelan County, Washington, and Constellation acting as power marketer and managing transmission. This is a real PPA — it reportedly carries financial penalties for non-delivery, a stronger commercial signal than a memorandum of understanding. CFS, in turn, applied to PJM interconnection in March 2026 (the first fusion company to do so) for its ~400 MWe ARC plant — the “Fall Line Fusion Power Station” in Chesterfield County, Virginia — targeting the early 2030s. These are genuine commercial-infrastructure signals. But every one of them is a target, a PPA or an application, not delivered power: the Orion plant is under construction but 50 MW of real electricity is undemonstrated; a grid-interconnection application is entry into a queue (where SMR and renewables also wait years), not a built plant; and ARC’s premise, SPARC net Q>1, is itself a 2027 target that is not yet demonstrated.
The bottleneck is economics — and there is no measured number to stand on
The firm’s recurring lens — “the headline is the starting point; the real bottleneck is elsewhere” — translates on the commercial axis into one sentence: fusion’s commercial bottleneck is timeline and economics, not science, and an ignition milestone does not lower the LCOE stack. The first fact of fusion economics is an absence: because no fusion plant operates anywhere, there is no measured LCOE, no measured capex and no measured availability. Every fusion LCOE in circulation is a modeling output. The most careful independent model (Böhnlein et al. 2026) puts mature-plant LCOE at MCF $114.6, ICF $110.3 and MIF $143.9/MWh — under a >30% learning-rate assumption that the authors themselves label “rather optimistic,” while cautioning policymakers about developers’ competitiveness claims. Even the mature modeling tool in this domain, the CATF Fusion Cost Model, explicitly declines to produce an absolute number, stating its outputs are “not intended to represent absolute or realistic values” and are for relative comparison only. Meanwhile the denominator’s key terms — tritium fuel (a closed-loop tritium breeding ratio, TBR>1, has never been demonstrated) and neutron-durable first-wall materials (no qualification facility exists) — remain unquantified, so fuel and O&M costs cannot yet be priced. A scientific milestone such as ignition changes none of these lines.
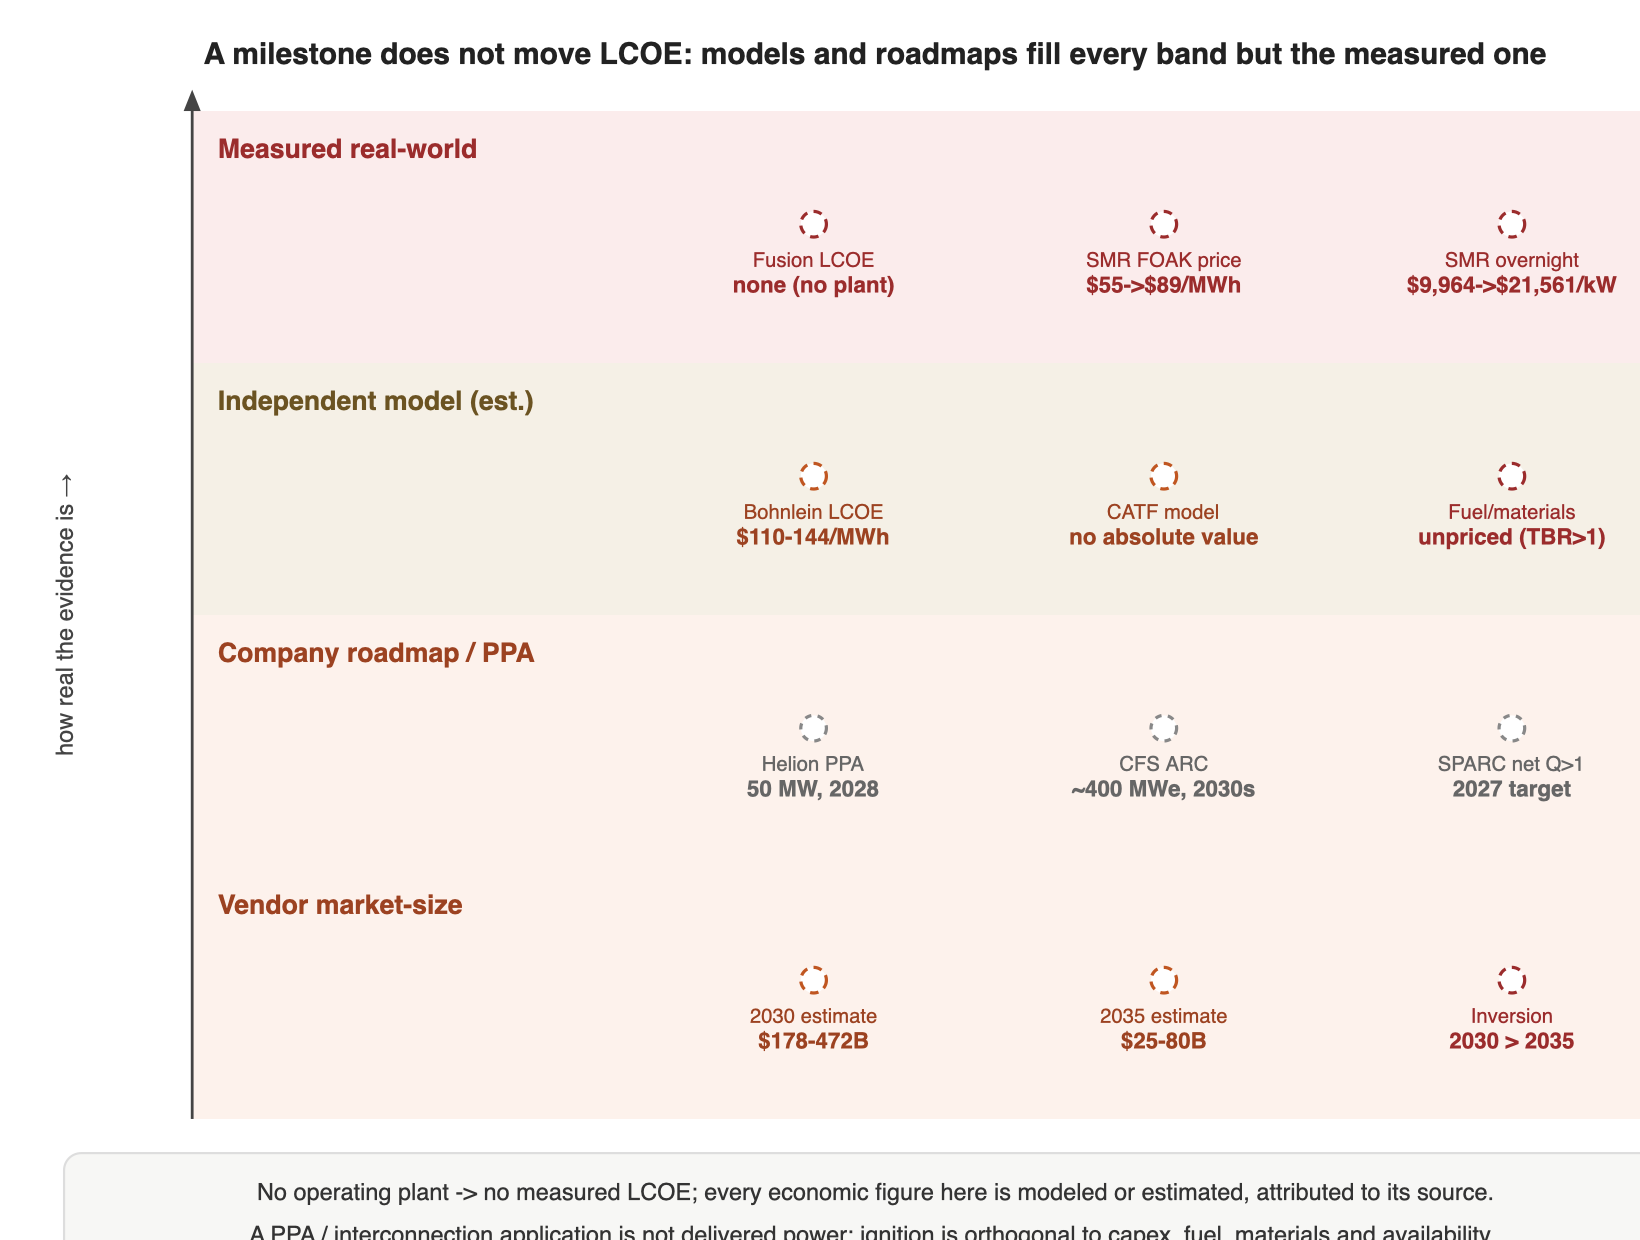
| Item | Status | Attribution |
|---|---|---|
| Helion 50 MW, 2028 delivery | Roadmap / PPA (undemonstrated) | Microsoft PPA 2023-05; Orion under construction; Constellation marketer; financial penalty (company / CNBC) |
| CFS ARC ~400 MWe, early 2030s | Roadmap (application) | Virginia Fall Line; PJM interconnection application 2026-03 (CFS / WNN) |
| CFS SPARC net Q>1 | Target 2027 (undemonstrated) | Operation target 2026; first of 18 HTS magnets installed (CES 2026) (CFS / Fortune) |
| Measured fusion LCOE | Absent (no operating plant) | All figures are modeled / estimated |
| Independent modeled LCOE (mature) | Modeled — “rather optimistic” | Böhnlein et al. 2026: MCF $114.6 / ICF $110.3 / MIF $143.9/MWh (>30% learning rate) |
| CATF cost-model absolute value | Self-disclaimed | “not intended to represent absolute or realistic values” (relative comparison only) |
| Fission SMR FOAK economics (contrast) | Ran aground (demonstrated) | NuScale/UAMPS cancelled 2023-11; $55→$89/MWh; overnight $9,964→$21,561/kW |
| Vendor “fusion market size” | Flagged (internally inconsistent) | 2030 $178–472B vs 2035 $25–80B (a 2030>2035 inversion) |
Deep dive
1. Background — the thesis: a scientific milestone does not move the LCOE stack
This series’ spine (“the headline is the starting point; the real bottleneck is the delivered layer”) translates on the commercial axis into one sentence: fusion’s commercial bottleneck is timeline and economics, not science, and a scientific milestone such as ignition (NIF’s Qplasma>1, 2022) does not lower the LCOE stack. LCOE is a function of capex (construction), fuel (tritium), materials (neutron-durable structural components), availability (duty cycle) and O&M. Ignition touches none of these directly — it grows the numerator (fusion energy) while leaving the denominator (whole-plant capital and operating cost) and the availability factor untouched. The scientific headline and the LCOE stack are orthogonal. Yet the commercial narrative runs the other way, led by “2030s grid” roadmaps — which are real, but which sit on top of three economic realities: (1) no operating plant, so no measured LCOE; (2) even independent models put mature-plant LCOE at $110–144/MWh and call that “rather optimistic,” with first-of-a-kind higher; and (3) a much higher-TRL neighbor, fission SMR, has already run aground on first-of-a-kind economics.
2. What this landscape establishes — “2030s grid”: roadmap/PPA vs operating plant (all attributed)
Principle: every date and figure is separated into company roadmap/PPA, independent modeled, or agency/press — and a PPA, application or target is never called an operating plant.
- Helion Energy — world’s first fusion PPA with Microsoft (2023-05), 50 MW (after a one-year ramp), 2028 target, Orion plant under construction in Chelan County WA (2025), Constellation as power marketer managing transmission, with a financial penalty for non-delivery. This is a real PPA — a stronger contractual signal than a simple MOU — but still PPA ≠ delivered power. The CEO’s framing (quote ≤150 chars): “we believe we can deliver this power… committed to it with our own financial incentives” — self-confidence, not demonstration.
- CFS (ARC) — ~400 MWe in Virginia (Fall Line Fusion Power Station, Chesterfield County), PJM interconnection application (2026-03, the first fusion company), targeting the early 2030s. An interconnection application is queue entry, not commissioning; ARC’s premise, SPARC net Q>1, is a 2027 target that is undemonstrated — so ARC is a roadmap layered on an undemonstrated milestone.
- CFS (SPARC) — net Q>1 targeted for 2027, operation target 2026, first of 18 HTS magnets installed (CES 2026). Target/construction; Q>1 undemonstrated.
- ITER (public anchor) — the 2024 new baseline pushed deuterium-tritium (DT) operation from 2035 to 2039 and added roughly €5bn; a reminder of the structural delay tendency of large fusion projects, even as private teams argue “HTS magnets make us different.”
- Industry anchor — the Fusion Industry Association’s 2025 survey: cumulative private funding of roughly $9.7bn across 53 companies, with about $2.64bn in the trailing 12 months (25 US companies).
Attribution rule: Helion 2028 and CFS ARC early-2030s are all target/roadmap/PPA, not operating plants. A grid-connection application is not a built plant. “2030s grid” is a year of promise, not a year of demonstration.
3. Methodology strengths and limits — LCOE reality: no measurement, and even the models admit optimism
- Independent (non-company) model — Böhnlein et al. 2026 (arXiv 2606.26536, 2026-06-25): mature-plant average LCOE of MCF (magnetic confinement) $114.6, ICF (inertial confinement) $110.3 and MIF (magneto-inertial) $143.9/MWh. These are next-of-a-kind values under a >30% learning-rate assumption; the authors call them “rather optimistic” and caution policymakers about developer competitiveness claims. Even at the most favorable framing, this is more expensive than renewables-plus-storage or gas, and first-of-a-kind would be higher.
- The tool’s self-disclaimer — CATF Fusion Cost Model: the Clean Air Task Force’s public cost model explicitly states its outputs are “not intended to represent absolute or realistic values” and are for relative comparison and cost-driver identification only. Even the mature modeling tool in this domain declines to assert an absolute LCOE — a statement about the state of the economic data.
- Capex intensity: no audited figure exists. Private teams claim miniaturization (HTS magnets) lowers capex, but no measured first-of-a-kind fusion overnight cost exists. For reference, ITER’s 2024 baseline added roughly €5bn, and fission SMR (NuScale) overnight cost more than doubled to $21,561/kW in eight years (§5) — adjacent benchmarks for the upside risk of nuclear first-of-a-kind capex.
- Tritium / materials cost: DT fuel’s tritium is naturally scarce (12.3-year half-life), so a plant must breed its own via a blanket at TBR>1 — and no device has demonstrated a closed-loop TBR>1, so fuel self-sufficiency is undemonstrated and fuel cost cannot be priced. First-wall neutron-durable materials also lack a qualification facility, so replacement cycles and O&M are unknown — the core terms of the LCOE denominator are unquantifiable.
Core point: the ignition milestone (NIF 2022) lowers none of these lines. LCOE is driven by capex, tritium, materials, availability and O&M — and ignition is orthogonal to all of them. “Scientific milestone ≠ lower LCOE” is the economic-axis thesis of this part.
4. Neighboring domains — data-center baseload demand, fission SMR, and long-duration storage
- Computing-power (data-center baseload): the demand-pull behind Helion–Microsoft (50 MW) and CFS ARC (PJM application) is the AI data center’s appetite for 24/7 carbon-free baseload (a 2035 figure of roughly 1,300 TWh, attributed to a prior energy-reactor analysis). A data-center offtaker’s willingness to pay may be the only early market that tolerates a high first-of-a-kind LCOE — but the same demand is being contested by higher-TRL SMR and near-term renewables-plus-storage, and a PPA/roadmap is still not delivered power.
- Energy-reactor (fission SMR): a direct competitor and mirror. SMR is a demonstrated technology (reactors have 60+ years of operating history) with a higher TRL and regulatory path than fusion — yet its first commercial project ran aground on economics (§5). “Higher TRL still ran aground on FOAK economics” is a disconfirming benchmark for fusion LCOE optimism.
- Energy-storage (LDES firming): while commercial fusion slips to 2040–2050+, the firm/baseload gap is filled by renewables-plus-storage (long-duration energy storage) and SMR. The storage-side conclusion that “GWh manufacturability and $/kWh are the real bottleneck” reappears in fusion as “no operating plant → no measured LCOE, only models.” A scientific milestone does not change the delivered-layer cost — the energy extreme of this series’ spine.
5. Commercialization and investment view — TRL, the SMR contrast, and “always 30 years away”
- Maturity (TRL frame): the science (ignition, Qplasma>1) is a physics milestone, but on the commercial axis there is no operating plant, no measured LCOE and no first-of-a-kind capex. The gating layers are timeline, capex, tritium/materials and availability — not the plasma-physics headline.
- The SMR contrast is decisive: NuScale/UAMPS’ Carbon Free Power Project — the first US SMR project — was cancelled on 2023-11-08 amid subscriber shortfall and cost escalation. Its target price rose $55→$89/MWh (2021→2023), its construction estimate rose $5.3B→$9.3B (+75%), and its overnight cost rose $9,964→$21,561/kW (2015→2023, more than double). A TRL-9-class technology (fission) slipped this far on first-of-a-kind cost — and fusion has not yet even reached the FOAK construction gate (it must first cross engineering Q>1, TBR>1 and durable materials). This is a neutral fact about the structural difficulty of first-of-a-kind economics, not a negative implication for any listed security (NuScale trades as NYSE: SMR; Oklo as NYSE: OKLO).
- Listed exposure: there is currently no publicly listed pure-play fusion company. Listed exposure is indirect — through big-tech offtakers/investors (Microsoft as offtaker; Google, Nvidia as investors) and fission-SMR adjacencies (NuScale, Oklo). Private fusion companies (CFS, Helion, TAE, Zap, General Fusion, First Light, Pacific Fusion, Marvel) are described factually and neutrally.
- “Always 30 years away”: for half a century fusion has been “30 years away,” and after 30 years it was still “30 years away.” The public anchor is ITER’s repeated slippage (DT 2035→2039, +€5bn). The recent private boom (FIA cumulative ~$9.7bn, 53 companies) introduces genuinely new elements — HTS (REBCO) magnets that speed iteration, and private/big-tech demand-pull — but the decisive economic evidence (measured LCOE, FOAK capex, fuel/materials cost) has not been observed, and the SMR cancellation reconfirms the pattern on the economics axis.
6. The skeptic’s bottom line
- PPA/roadmap ≠ operating plant: Helion 2028 and CFS ARC are targets/applications, not delivered power.
- Modeled LCOE ≠ measured LCOE: no operating plant exists, so no measured LCOE exists; even the independent model calls its mature-plant $110–144/MWh “rather optimistic,” and the CATF model declines to produce an absolute value at all.
- Company projection ≠ independent: private capex-reduction claims are unverified; the independent model and the mature cost-modeling tool both disclaim absolute certainty.
- Fuel/materials cost unquantified: closed-loop TBR>1 and durable first-wall materials are undemonstrated, so the core terms of the LCOE denominator cannot be priced.
- Market-size projections are internally inconsistent (flagged): vendor “fusion market size” runs 2030 $178–472B vs 2035 $25–80B — a 2030>2035 inversion. Definitions differ (R&D/equipment spend vs power-sales revenue vs components) and power-sales revenue is currently $0, so these are market-research-mill outputs. Do not cite any single figure.
- Scientific milestone ≠ LCOE: ignition is orthogonal to capex, fuel, materials and availability. The commercial bottleneck is timeline and economics, not science.
- Neutral-framing note: to prevent misreading listed-adjacency (NYSE: SMR, OKLO) or big-tech-offtaker implications as security signals. Verdict: proceed-with-caveats.
7. What to watch (falsifiable)
- P1 — roadmap demonstrated vs deferred: if Helion delivers measured electricity from Orion to a grid/data center within 2028±1, or CFS achieves SPARC net Q>1 (2027 target) and breaks ground on ARC on schedule, the “this time is different” case strengthens. If leading roadmaps repeatedly defer without demonstration (PPA renegotiation, interconnection-queue backlog), the “always 30 years away” case strengthens. (Watch: Helion/CFS delivered-power and groundbreaking announcements; PJM queue status.)
- P2 — first measured economics (LCOE absence resolved): if any device discloses a first-of-a-kind fusion plant’s measured overnight cost, availability and tritium consumption/breeding, and it can be compared against the independent-model $110–144/MWh band, the economic axis gains its first empirical basis. If the measured figure greatly exceeds the model (as SMR did, roughly doubling), the “always 30 years away” case strengthens. (Watch: first commercial-plant financial/performance data; IAEA/DOE or independent audit.)
- P3 — demand-pull vs competitive pre-emption: if data-center baseload demand (a 2035 figure of roughly 1,300 TWh) materializes as an offtaker market that tolerates high FOAK fusion LCOE, that is a “this time is different” signal; if higher-TRL SMR and near-term renewables-plus-storage pre-empt the same demand, the fusion economics window narrows. (Watch: whether data-center PPAs are actually delivered/built; SMR and LDES contract share.)
References
- Helion Energy. 2023. “Helion Announces World’s First Fusion PPA with Microsoft.” https://www.helionenergy.com/newsroom/helion-announces-worlds-first-fusion-ppa-with-microsoft
- CNBC. 2023. “Microsoft agrees to buy power from Sam Altman-backed Helion in 2028.” https://www.cnbc.com/2023/05/10/microsoft-agrees-to-buy-power-from-sam-altman-backed-helion-in-2028.html
- Commonwealth Fusion Systems. 2026. “CFS becomes first fusion company to apply to PJM interconnection.” https://cfs.energy/news-and-media/commonwealth-fusion-systems-becomes-first-fusion-company-to-apply-to-pjm-interconnection
- World Nuclear News. 2026. “Grid connection requested for US fusion power plant.” https://www.world-nuclear-news.org/articles/grid-connection-requested-for-us-fusion-power-plant
- Böhnlein et al. 2026. Independent fusion cost model (mature-plant LCOE MCF $114.6 / ICF $110.3 / MIF $143.9/MWh; “rather optimistic”). arXiv:2606.26536. https://arxiv.org/abs/2606.26536
- Clean Air Task Force. Fusion Cost Model (“not intended to represent absolute or realistic values”). https://www.catf.us/fusion-energy/fusion-cost-model/
- Utility Dive. 2023. “NuScale, UAMPS terminate small modular reactor project.” (target $55→$89/MWh; overnight $9,964→$21,561/kW). https://www.utilitydive.com/news/nuscale-uamps-project-small-modular-reactor-ramanasmr-/705717/
- E&E News. 2023. “NuScale cancels first-of-a-kind nuclear project as costs surge.” https://www.eenews.net/articles/nuscale-cancels-first-of-a-kind-nuclear-project-as-costs-surge/
- ITER Organization. “Updated baseline presented” (DT operation 2035→2039; +€5bn). https://www.iter.org/node/20687/updated-baseline-presented
Disclosure
This post is for information only and is not investment advice.
COI note: this post describes private fusion companies and their offtakers/investors (Helion Energy with Microsoft as offtaker; Commonwealth Fusion Systems; and, as a fission-SMR contrast, NuScale) in a descriptive, neutral context. There is currently no publicly listed pure-play fusion company; listed exposure is indirect, through big-tech offtakers/investors (Microsoft, and investors such as Google and Nvidia) and fission-SMR adjacencies (NuScale, NYSE: SMR; Oklo, NYSE: OKLO). Because no fusion plant operates, no measured LCOE, capex or availability exists — every economic figure here is modeled or estimated, attributed to its source, and company roadmaps/PPAs are separated from operating plants (a PPA or interconnection application is not delivered power). Private-company valuations and market-size projections are unverified and, in the case of “fusion market size,” internally inconsistent — flagged, not cited. Quantitative claims are attributed to the vendor, author or preprint. Statements about companies and programs are factual, neutral descriptions and are not buy/sell implications for any security. The author holds no position in, and has no financial interest in, the companies named.


Leave a Reply