Evidence-first notes on bioscience and deep tech, at the edge of the lab and the market. Information only — not investment advice. Every launch price, subscriber count, revenue figure and constellation size is attributed to the disclosure, filing or report it comes from, and company claims, agency data and analyst estimates are kept separate. Marketed dollars-per-kilogram is not internal cost; announced is not deployed. Figures for private entities (SpaceX, Starlink) are reported or estimated and are labeled unverified where I could not confirm them against a primary document.
The 30-second version
- What. The space economy is a three-layer stack — LAUNCH (reusable rockets) × SATELLITES (low-Earth-orbit mega-constellations) × APPLICATIONS (Earth observation, satellite broadband, direct-to-cell, PNT/GNSS, in-space services). On the headline metric it has already moved: reusable Falcon 9 launch dropped to roughly $2,700–3,000/kg to LEO, about a 90% fall from the ~$54,500/kg Space Shuttle era (trade-press, secondary). That collapse is real — Falcon 9 first stages have re-flown hundreds of times.
- So what. The headline (dollars per kilogram) is largely solved; the real bottleneck sits in the outcome layer — sustainable unit economics and genuine paying downstream demand, not launch price. Cheap launch is not the same as a profitable space business. Marketed price is not internal cost; announced capacity is not deployed; a growing launch cadence is not a launch profit. Value is captured mostly downstream: Space Foundation puts the 2024 space economy at $613B, of which satellite services are ~$108B and ground equipment ~$155B, while launch is a small slice (agency data).
- Now what. The falsifiable central question is whether the launch-cost collapse translates into a large, durable multi-player economy, or whether it mostly feeds one vertically integrated player (Starlink), leaving downstream demand thin. On current data the single-player reading fits best: the only operator demonstrating large-scale deployment and cash flow is Starlink. Post-series correction: SpaceX is no longer private — it IPO’d on 2026-06-12 (ticker SPCX, ~$1.77T reported); the prior “private” premise is reversed, though Starlink’s audited unit economics remain partly opaque. The claim that “the launch-cost collapse already built a large, profitable multi-player commercial space economy” is refuted.
The five-minute read
Three layers — and why the headline is not the bottleneck
The space economy stacks in three layers, and the rate-limiting step differs at each. LAUNCH (upstream) is where the cost collapse actually happened: reuse took Falcon 9 to roughly $2,700–3,000/kg to LEO, about 90% below the Shuttle era (secondary, attributed). But that is a price, not SpaceX’s internal cost, and a rising launch cadence is not the same as a launch profit. SATELLITES (midstream) is capital-intensive and gated by execution: Starlink runs ~7,000+ spacecraft, whereas Amazon Leo (formerly Kuiper) had deployed only ~270, which is why the FCC extended its 50%-deployment deadline from 2026 to 2027 — the textbook gap between announced and deployed. APPLICATIONS (downstream) is where value is actually captured, and where effective demand is the real limiter.
The firm’s recurring lens — “the headline is the starting point; the real bottleneck is elsewhere” — applies cleanly. The Falcon 9 cost collapse is the one part of the outcome layer that is demonstrated. What is not settled: SpaceX’s internal launch cost and the profitability of the launch business itself (undisclosed); whether Starship’s 100-tonne / $100–200/kg targets hold (full reuse and orbital payload deployment are not yet demonstrated); whether announced constellations actually deploy and turn a profit; and whether multiple independent downstream businesses can each reach durable profit rather than remaining pinned to government anchors.
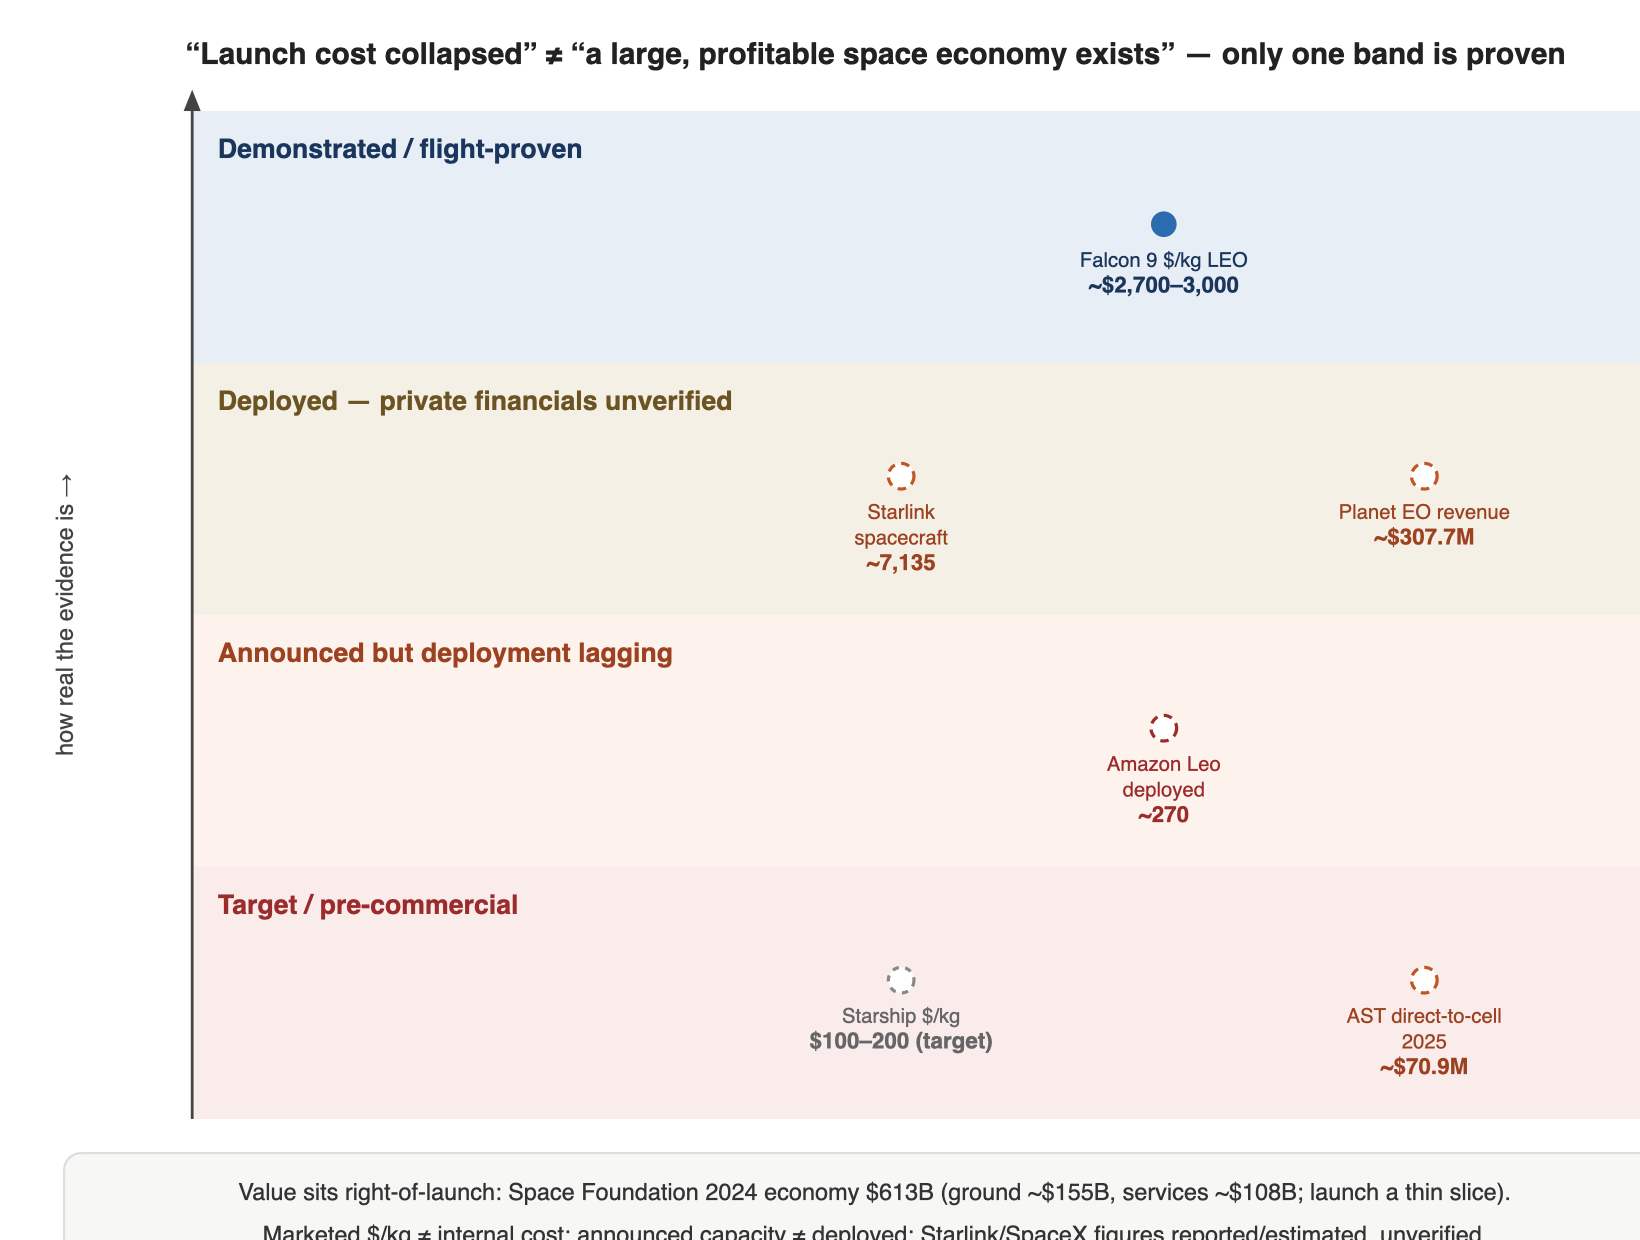
| Layer | Status (2026-07, attributed) | Verdict |
|---|---|---|
| Launch cost ($/kg, headline) | Falcon 9 reuse ~$2,700–3,000/kg LEO, ~90% below Shuttle; first stages re-flown hundreds of times (trade-press, secondary) | Demonstrated (price, not internal cost) |
| Next-gen launch (Starship) | 100 t / $100–200/kg are design targets; 12 flights, 7 success / 5 failure; full reuse and orbital payload deployment not demonstrated | Target, unproven |
| Satellites — leader | Starlink ~7,135 spacecraft; subscribers ~8.9M (2025) / 10.3M (2026-03); Connectivity revenue ~$11.39B (2025) — SpaceX S-1 (reported) / analyst, not independently confirmed | Deployed, private financials unverified |
| Satellites — chasers | Amazon Leo ~270 deployed, FCC 50% deadline extended 2026→2027; announced ≠ deployed | Deployment lagging |
| Applications (downstream) | Planet EO FY2026 ~$307.7M; AST direct-to-cell 2025 ~$70.9M (mostly gateway/government); Intuitive Machines IM-2 landed but tipped over — value capture, but profit unproven | Effective demand is the limiter |
| Outcome-layer friction | ESA 2025: >10 cm ~54,000 objects; Starlink ~300,000 avoidance maneuvers in 2025 (+50% YoY); spectrum/FCC priority | Growth ceiling, unresolved |
Deep dive
1. Background — a three-layer stack where announced ≠ deployed ≠ operational ≠ profitable
The headline of this domain is almost always the collapse of launch cost to orbit. That collapse is real: Falcon 9 first-stage reuse has been demonstrated across hundreds of re-flights, taking marketed launch price to roughly $2,700–3,000/kg to LEO, about 90% below the ~$54,500/kg Shuttle era (secondary, attributed). But the actual bottleneck is not launch price. It is the outcome layer — whether cheap launch translates into sustainable unit economics and genuine paying downstream demand. Cheap launch is not a profitable space business, and that is the through-line of this series.
The stack is LAUNCH (reusable rockets — Falcon 9, Starship, Neutron) upstream, SATELLITES (LEO mega-constellations — Starlink, Amazon Leo, OneWeb) midstream, and APPLICATIONS (Earth observation, satellite broadband, direct-to-cell, PNT/GNSS, in-space manufacturing and services) downstream. Placing all three together matters because the cost collapse is demonstrated upstream, but value is actually captured downstream — and if downstream demand is thin, cheap launch does not translate into a large, durable business. At every layer sits a stack of gaps: announced capacity is not deployed, deployed is not operational, and operational is not profitable.
2. What this landscape establishes — layer by layer (disclosure/filing-attributed)
Principle: launch prices, subscriber counts, revenue and constellation sizes are reported as in the source; company claims, agency data and analyst estimates are separated; and cross-program numbers are not head-to-head.
- LAUNCH. Falcon 9 (SpaceX) reuse ~$2,700–3,000/kg LEO, first stages re-flown hundreds of times (trade-press, secondary). Starship targets 100 t and $100–200/kg, debuted v3 (Flight 12) in 2026-05, with 12 flights at 7 success / 5 failure and a tower catch on Flight 5 — but full reuse and orbital payload deployment remain undemonstrated (Wikipedia, secondary). Rocket Lab (RKLB) reported 2025 revenue $601.8M (+38%), Electron at 21 launches / 100% success, a $1.1B backlog, and Neutron’s first flight slipped to mid-2026 (SEC 10-K, primary). Blue Origin’s New Glenn is early-stage.
- SATELLITES. Starlink runs ~7,135 spacecraft (2025 estimate), with subscribers ~8.9M (end-2025) rising to ~10.3M (2026-03) and Connectivity revenue ~$11.39B (2025) — but these come from SpaceX’s S-1 as reported in press and from analyst estimates, and I could not independently confirm them against a primary document (unverified). Amazon Leo (formerly Kuiper) had ~270+ deployed by 2026-07, prompting the FCC to extend its 50%-deployment deadline from 2026-07 to 2027-07 (FCC/GeekWire, primary/quasi-primary); a Gen2 authorization of 4,500 (7,727 total) is approved. OneWeb (Eutelsat) runs ~630 first-generation LEO satellites with a history of financial restructuring.
- APPLICATIONS. Planet Labs (PL) reported FY2026 (ended 2026-01) revenue ~$307.7M (+26%), operating hundreds of Dove/SkySat satellites, with GAAP profitability still ahead (filing/stockanalysis, primary). AST SpaceMobile (ASTS) reported 2025 revenue $70.9M, mostly gateway and government, and states it needs ~45–60 satellites for continuous service (targeted for end-2026) — pre-commercial (SEC 8-K, primary). Intuitive Machines (LUNR): the IM-2 lander touched down in 2025-03 but tipped over (on its side, power-starved); IM-2 contract revenue was $131.2M and a new CLPS award (Nova-D) is $180.4M — early commercial, with a partial-mission-failure history (SEC 10-K, primary).
- Market anchor. Space Foundation’s The Space Report 2025 Q2 puts the 2024 space economy at $613B (+7.8%), 78% commercial and $132B government, of which satellite services are ~$108B and ground equipment ~$155B (primary, agency data). Value is captured mostly at the ground and services layers; launch is a small slice.
Attribution note: the above are within-filing figures. Starlink’s ~$11.39B is from the (then-private) SpaceX S-1 as reported in press and analyst estimates, not independently confirmed (unverified). Falcon 9 ~$2,700/kg versus Starship’s $100/kg is marketed/target price, not internal cost — not a head-to-head. Listed-company financials (RKLB, PL, ASTS, LUNR) are kept separate from private estimates.
3. The central commercial question — does the cost collapse become a large space economy? (falsifiable)
Launch cost has already collapsed at the outcome layer (Falcon 9, ~90% down). The falsifiable question is which of three outcomes follows.
- (a) Single-player capture. The collapse mostly feeds one vertically integrated player (Starlink/SpaceX), leaving downstream thin. Evidence: SpaceX integrates launch (Falcon 9) and satellites (Starlink) and is the only operator demonstrating large-scale deployment and cash flow (Connectivity ~$11.39B, ~8.9M subscribers, S-1 as reported), while Amazon Leo lags on deployment and AST is pre-commercial. Falsified if multiple independent downstream businesses (EO, direct-to-cell, in-space) each reach durable profit and large effective demand.
- (b) Broad, durable multi-player economy. Cheap launch opens large downstream markets and several profitable businesses stand up. Evidence: Space Foundation’s $613B — with $108B satellite services and $155B ground equipment — shows large existing value at the ground/services layer. Falsified if downstream revenue stays concentrated in government contracts and a few anchor customers, or many announced constellations fail to deploy or profit.
- (c) Bubble, then a durable few. Current valuations and announcements run ahead of demand; after a shakeout only a few survive (government-anchored EO, broadband). Evidence: constellation capital intensity, Amazon Leo’s deployment lag, AST pre-revenue with volatile pricing, and Kessler/spectrum friction. Falsified if most announced constellations reach deployment, continuous service and profit, and debris/spectrum friction does not cap growth.
Tentative position: none of the three is excluded, but (a) fits current data best — the only operator with demonstrated large-scale deployment and cash flow is Starlink; the rest are deployment-lagging, pre-commercial or partially failed. The decider between (a) and (b) is whether independent downstream businesses outside Starlink demonstrate profit and demand; the decider for (c) is the real deployment rate of announced constellations against debris/spectrum friction. Part 0 places the three side by side rather than settling on one.
4. The outcome-layer bottleneck — where the firm’s lens bites
- Marketed $/kg ≠ internal cost ≠ profit. Public launch prices ($2,700/kg) are prices, not SpaceX’s internal cost, and cadence/revenue is not launch-business profit. Starship’s $100–200/kg is a design target contingent on full reuse and orbital payload deployment (Part 1).
- Announced capacity ≠ deployed ≠ operational. Amazon Leo deployed ~270 of an announced 3,236, extending its FCC deadline to 2027; AST needs ~45–60 satellites for continuous service but has deployed only a few. The gap between “announced size” and “actually in service in orbit” is the constellation outcome layer (Parts 2–3).
- Value capture is downstream and on the ground. Space Foundation: satellite services ~$108B and ground equipment ~$155B dwarf launch. “Launch got cheaper” is not “the space economy grows”; who gets paid downstream is the limiter, tested by Planet (EO) and AST (D2C) profitability (Part 3).
- Kessler / spectrum / regulation = growth-layer friction. ESA’s 2025 orbital-environment report: ~54,000 objects >10 cm (~43,500 tracked), ~11,800 active satellites (Starlink ~7,135); Starlink ran ~300,000 avoidance maneuvers in 2025 (+50% YoY), with a CRASH clock of 2.8 days (121 days in 2018). Orbital congestion, spectrum priority (FCC) and debris may set the ceiling on constellation expansion (Part 4).
- Cross-domain up/downstream. The downlink data flood feeds ground-station compute and data-center power (the firm’s computing-power axis); GNSS/PNT vulnerability strengthens the commercial logic of quantum inertial navigation (the firm’s quantum-sensing axis). Space is both the upstream and the demand source for these two firm threads.
5. Commercialization and competitive context (TRL frame)
- Maturity: the Falcon 9 launch-cost collapse is demonstrated (outcome layer), but downstream profit and multi-player durability are early/unproven. Announced is not deployed; deployed is not profitable.
- SpaceX / Starlink (now SPCX): the only vertically integrated operator demonstrating large-scale deployment and cash flow. Post-series correction: SpaceX is no longer private — it IPO’d on 2026-06-12 (ticker SPCX, Nasdaq, ~$1.77T reported, described in press as the largest US IPO). Starlink’s unit economics remain partly opaque pending audited financials; subscriber/revenue/margin figures are reported/estimated (unverified).
- Rocket Lab (RKLB): 2025 revenue $601.8M (+38%), Electron at 100% success, $1.1B backlog; Neutron’s medium-lift reusable debut slipped to mid-2026 (SEC 10-K).
- Planet Labs (PL): EO revenue FY2026 ~$307.7M (+26%); GAAP profitability still ahead (filing).
- AST SpaceMobile (ASTS): 2025 revenue $70.9M (mostly gateway/government), pre-commercial, needs ~45–60 satellites for continuous service (SEC 8-K).
- Intuitive Machines (LUNR): IM-2 landed but tipped over (power-starved); IM-2 contract revenue $131.2M, new CLPS (Nova-D) $180.4M — early commercial with a partial-failure history (SEC 10-K).
- Company implications are limited to neutral, filing/report-attributed description. ASTS and LUNR are pre/low-revenue pure-plays whose prices are sensitive to launch and debut news; nothing here is a buy/sell signal.
6. The skeptic’s bottom line
- Cheap launch ≠ profitable space business: the cost collapse is real and upstream; profit and demand live downstream, and downstream is unproven beyond broadband.
- Marketed price ≠ internal cost ≠ profit: SpaceX’s internal launch cost and launch-business profitability are undisclosed; a rising cadence is not a profit.
- Announced ≠ deployed: Amazon Leo and AST are the textbook cases (deployment lag, FCC deadline extension).
- Private financials are reported/estimated: Starlink subscribers/revenue/margin are from the S-1 as reported in press and analyst estimates — I could not confirm them against a primary document (unverified). Even after the SPCX IPO, audited Starlink unit economics are still pending.
- Refuted claim: “the launch-cost collapse already built a large, profitable multi-player commercial space economy” — the only operator with demonstrated large-scale deployment and cash flow is Starlink; the rest lag, are pre-commercial or partially failed. Do not inherit that hype.
- Neutral-framing note: to prevent misreading listed-company (RKLB, PL, ASTS, LUNR) or SPCX implications as security signals.
7. What to watch (falsifiable)
- P1: outside Starlink, whether multiple downstream businesses (Planet EO, AST D2C, in-space) each reach durable profit and large effective demand — strengthening (b) — or revenue stays concentrated in government anchors — moving toward (a). (Tested in Part 3.)
- P2: whether Amazon Leo (and later D2C/EO constellations) reach real deployment, continuous service and profit within FCC deadlines — a multi-player signal — or many fail, moving toward (c) (announced ≠ deployed). (Tested in Parts 2 and 4.)
- P3: whether orbital-congestion, debris and spectrum-priority friction actually raise constellation, insurance and regulatory costs — strengthening (c) — while GNSS/PNT vulnerability lifts the commercial logic of quantum inertial navigation and the downlink data flood lifts ground-station compute and data-center power, confirming the cross-domain links. (Tested in Parts 4 and 5.)
- Also watch: whether SpaceX’s audited (post-SPCX) financials confirm Starlink’s reported unit economics, and whether Starship demonstrates full reuse and orbital payload deployment at anything near its $/kg target.
References
- Space Foundation. 2025. The Space Report 2025 Q2 (2024 space economy $613B; satellite services ~$108B; ground equipment ~$155B). https://www.spacefoundation.org/2025/07/22/the-space-report-2025-q2/
- European Space Agency. 2025. ESA Space Environment Report 2025 (orbital debris; >10 cm objects; active satellites). https://www.esa.int/Space_Safety/Space_Debris/ESA_Space_Environment_Report_2025
- Amazon Kuiper / FCC deployment waiver (50% deadline extension, spectrum conditions). https://orbital-intel.com/news/amazon-kuiper-fcc-deployment-waiver-spectrum-conditions/
- Rocket Lab. 2025. Form 10-K (2025 revenue $601.8M; Electron; Neutron schedule; backlog). SEC EDGAR. https://www.sec.gov/Archives/edgar/data/1819994/000181999426000013/rklb-20251231.htm
- AST SpaceMobile. 2025. Form 8-K exhibit (2025 revenue $70.9M; service requirements). SEC EDGAR. https://www.sec.gov/Archives/edgar/data/1780312/000119312525274360/asts-ex99_1.htm
- Intuitive Machines. 2025. Form 10-K (IM-2 mission; contract revenue; CLPS awards). SEC EDGAR. https://www.sec.gov/Archives/edgar/data/1844452/000162828026019865/lunr-20251231.htm
- Planet Labs. Revenue history (FY2026 ~$307.7M). stockanalysis.com. https://stockanalysis.com/stocks/pl/revenue/
- List of Starship launches (flight count; success/failure; tower catch). Wikipedia (secondary). https://en.wikipedia.org/wiki/List_of_Starship_launches
- SpaceNews. “SpaceX’s new price chart illustrates performance, cost of reusability” (Falcon 9 pricing; reusability; secondary). https://spacenews.com/spacexs-new-price-chart-illustrates-performance-cost-of-reusability/
Disclosure
This post is for information only and is not investment advice.
COI note: this post describes listed companies (Rocket Lab RKLB, Planet PL, AST SpaceMobile ASTS, Intuitive Machines LUNR) and SpaceX (now listed, ticker SPCX, following its 2026-06-12 IPO) and their satellite/launch programs in a descriptive, neutral context. Every launch price, subscriber count, revenue figure and constellation size is attributed to the disclosure, filing or report it comes from; company claims, agency data and analyst estimates are kept separate. Listed-company financials are drawn from SEC filings; SpaceX/Starlink figures (subscribers, revenue, margin) are reported or estimated — from the S-1 as reported in press and from analyst estimates — and are labeled unverified where I could not confirm them against a primary document, with audited Starlink unit economics still pending after the SPCX IPO. Marketed dollars-per-kilogram is not internal cost, and announced capacity is not deployed. Quantitative claims are attributed to the vendor, agency or press/analyst source. Competitive and status statements are factual, neutral descriptions and are not buy/sell implications for any security. The author holds no position in, and has no financial interest in, the companies named.
 Uthando Nethemba
Leave a comment