Evidence-first notes on deep tech and the space economy, at the edge of the lab and the market. Information only — not investment advice. Every subscriber count, revenue, margin and capex figure is attributed to its source, and financial figures for Starlink/SpaceX are from a reported SpaceX S-1 or analyst estimates that could not be independently confirmed on SEC EDGAR (noted inline). Announced constellation size is separated throughout from deployed and operational satellites; company claims are separated from agency data (FCC, ITU, Eutelsat IR).
The 30-second version
- What. A LEO mega-constellation is capital-intensive, and announced does not equal deployed does not equal operational does not equal profitable. On the headline metric — announced fleet size — the sky is full: Starlink 12,000→42,000, China’s Qianfan and Guowang ~13,000–15,000 each, Amazon Leo 3,236 (7,774 total authorized), and Chinese ITU filings alone totaling nearly 200,000 satellites (SpaceNews). But at the outcome layer as of July 2026, only one player has demonstrated large-scale deployment, a reported segment profit and positive segment free cash flow: the vertically integrated incumbent, Starlink.
- So what. Per the reported S-1, Starlink’s Connectivity segment reached ~10.3M subscribers (2026-Q1), ~$11.39B revenue and ~$4.42B operating income (2025), and it clears the capex treadmill only by internalizing launch — Falcon 9 reuse — so segment EBITDA ~$7.17B exceeds segment capex ~$4.18B. Critical caveat: every one of these financials is from a reported SpaceX S-1 or analyst estimate and is unverified — it could not be independently confirmed on SEC EDGAR. And SpaceX’s consolidated ~$2.59B operating loss is driven by AI/xAI capex (~$12.7B), not by Starlink — the group loss must be separated from the Starlink segment profit.
- Now what. No one else has closed the economics. Amazon Leo is ~1% deployed (~365–400 of 3,236), has pre-spent >$10B on launch and has no revenue (commercial beta 2026-late to 2027); it missed its first FCC milestone and obtained relief. Eutelsat OneWeb operates 648 Gen1 satellites but leans on EU and government/export-credit money and cut Gen2 capex ~30%. Chinese constellations are ~1% deployed, missing their ITU 10% milestone, and are strategic rather than commercial. The decisive test is not headline fleet size — it is whether anyone outside Starlink can show an independent, self-funding segment profit.
The five-minute read
The headline is “the sky fills with constellations”; the outcome layer says only one has closed the economics
Part 0 of this series set a falsifiable question: does the collapse in launch cost (Falcon 9 roughly 90% lower) (a) mainly enrich the single vertically integrated player, (b) translate into a broad, durable multi-player economy, or (c) leave only a few survivors after a bubble and correction? At the satellite layer the headline is “mega-constellations fill the sky.” But the July 2026 outcome-layer data diverge sharply: the only constellation to demonstrate large-scale deployment, subscribers, a reported segment profit and (reported) positive segment free cash flow is the vertically integrated incumbent, Starlink. Everyone else is blocked at the outcome layer.
The reason matters. Satellites last roughly five years, so a constellation permanently demands replenishment launches — that is the structure of the “capex treadmill.” Starlink clears it only because it makes its own launch (Falcon 9 reuse) and recycles the surplus internally. An independent constellation that must buy launch on the open market cannot reproduce the same unit economics. This is why “cheap launch enables a downstream business” holds, on current data, only for whoever has internalized launch.
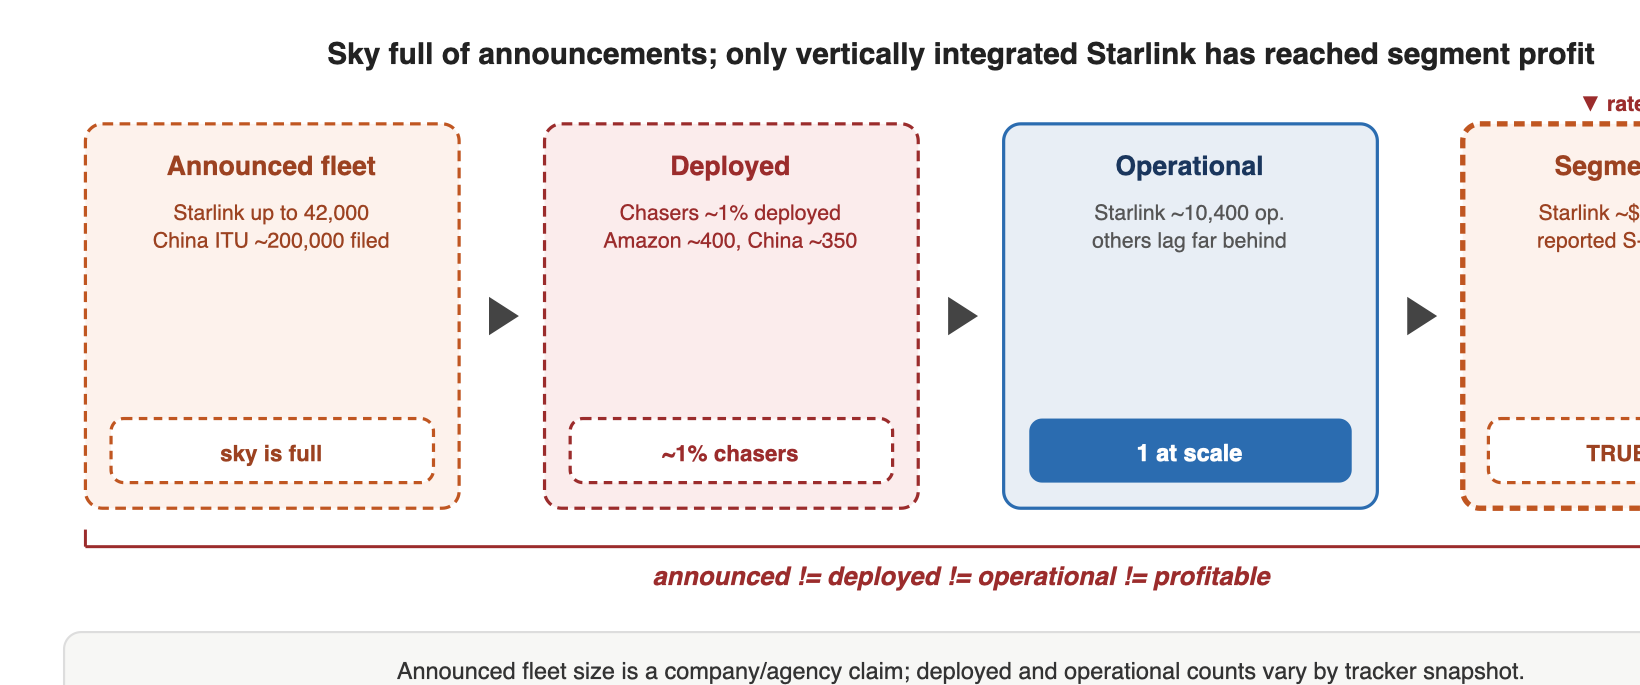
| Player (operator) | Announced | Deployed (2026-07) | Economics / funding character |
|---|---|---|---|
| Starlink (SpaceX, private) | 12,000→42,000 | ~10,400 operational | Only player with large-scale deployment + reported segment profit + positive segment FCF; internalizes launch (Falcon 9 reuse). All financials reported/estimated, unverified |
| Amazon Leo (Amazon AMZN) | 3,236 (7,774 authorized) | ~365–400 (~1%) | Amazon balance sheet; >$10B launch pre-spend (ULA, Arianespace, Blue Origin, 92 launches); no revenue (beta 2026-late–2027); missed FCC milestone, relief granted |
| Eutelsat OneWeb (Eutelsat ETL.PA) | Gen1 648 + Gen2 planned | 648 operational (1,200 km) | Financial strain, €535M GEO impairment; Gen2 capex cut ~30%; leans on EU / export-credit money; IRIS² 264 sats €2.1B |
| China Qianfan / Guowang (state) | ~13,000–15,000 each | ~350 total (~1%) | State/strategic, not commercial; misses ITU 10% (2029) milestone; thruster/gyro failures, 300+ debris fragments; ITU filings total ~200,000 (spectrum grab) |
Deep dive
1. Background — capital intensity and the “vertical-integration capture” hypothesis
The satellite layer sits in the midstream of the space economy: the business model and capital intensity of LEO mega-constellations. The headline layer is announced constellation size and subscriber counts; the outcome layer is deployed-plus-operational satellites, sustained segment profit and segment free cash flow. Part 0 asked whether cheap launch translates into a durable multi-player business, or whether it lets a single vertically integrated player (Starlink) demonstrate large-scale cash flow while the rest remain stuck in deployment delay, government dependence or strategic (state) motives.
Attribution principle for this piece: subscriber, revenue and capex figures are within-source values. Starlink financials are from second-hand reporting of a SpaceX S-1 and from analyst estimates; the consolidated income statement mixes in the xAI/AI segment, so the group operating loss must be separated from the Starlink segment operating profit. Announced size is always separated from deployed-plus-operational satellites, and company claims from agency data (FCC, ITU, Eutelsat IR).
2. Starlink — the only constellation that has demonstrated the outcome layer (with a private-company caveat)
Starlink is the only player at the satellite layer to demonstrate scale, subscribers and a (reported) segment profit simultaneously. Because SpaceX is private, however, the financials are reported/estimated, not primary-confirmed.
| Metric | Value (as reported / attributed) | Source character | Independently confirmed? |
|---|---|---|---|
| Operational satellites | ~10,400 (2026-06, ~10,397 operational) | Wikipedia / tracker (near-primary) | Partial (public orbital catalog) |
| Subscribers | ~10.3M (2026-Q1), more than 2x prior-year 4.4M | S-1 reporting (secondary) | No — private, unverified |
| ARPU | $99 (2023) → $86 (2025-Q1) → $66 (2026-Q1) | S-1 reporting (secondary) | No — private, unverified |
| Connectivity revenue | $11.39B (2025, +~50% YoY; 2024 $7.7B) | S-1 reporting (secondary) | No — private, unverified |
| Connectivity operating income | $4.42B (2025, margin ~39%) | S-1 reporting (secondary) | No — private, unverified |
| Connectivity Adj. EBITDA | $7.17B (2025, margin ~63%) | S-1 reporting (secondary) | No — private, unverified |
| Connectivity segment capex | ~$4.18B (2025) | S-1 reporting (secondary) | No — private, unverified |
| Direct-to-cell (DTC) | ~650+ satellites (2026-01), 22 countries, text/location; T-Mobile T-Satellite commercial 2025-07 | Company / T-Mobile (near-primary) | Partial |
| 2026 revenue outlook | ~$15.5B (estimate) | Analyst (secondary) | No — estimate |
The core reading — what the “path-to-cash-flow” claim really rests on. If the reported S-1 is accurate, the Starlink segment is already segment-level free-cash-flow positive: Adj. EBITDA ~$7.17B exceeds segment capex ~$4.18B. That is the basis for calling Starlink “SpaceX’s cash machine.” The mechanism is internalized launch — Falcon 9 self-launch and reuse — which an externally-launched competitor cannot match on unit cost. Critical separation: SpaceX’s consolidated ~$2.59B operating loss is driven by AI/xAI capex (reported ~$12.7B in 2025), not by Starlink. The Starlink business itself is (as reported) profitable and cash-generative; the group loss reflects a separate bet (AI). This is the decisive observation of the chapter — and it means Starlink has (on reported figures) demonstrated a way off the capex treadmill via segment cash flow, not merely more spending.
But the outcome-layer friction is real too (skeptic). ARPU has fallen structurally, $99→$66 (about −33% over two years), as the base expanded into lower-price markets in Africa, Southeast Asia and Latin America — subscribers doubled while operating income “barely moved” (TheNextWeb). The user terminal reportedly costs roughly 3x a ground modem to produce, a disadvantage against urban and suburban fiber/cable. Capacity is tied to Starship: the high-capacity V3 satellite needs Starship, which flew roughly 5 times in 2025 against a 25-flight target (test stage) — the ceiling on DTC and bandwidth expansion rests on an as-yet-unproven launcher. And valuation is contested: against a reported ~$1.75T SpaceX valuation, one skeptical view holds “only ~7% is real (cash-generating)” (SatNews), with a Morningstar fair value of $63 versus an IPO reference of $135 — a hype-contested area (escalated).
3. The chasers — the textbook of announced does not equal deployed
Outside Starlink, all three camps are blocked at the outcome layer (deployment, profit, cash flow). Announced size is large; deployment and economics lag far behind.
- Amazon Leo — the textbook case of announced ≠ deployed. Of 3,236 announced satellites, only ~365–400 are deployed (~1%), so it missed the first FCC milestone (1,618 satellites by 2026-07-30) and the FCC granted relief. It has committed >$10B in launch procurement (ULA, Arianespace, Blue Origin, 92 launches) but has no commercial revenue — a five-country beta is targeted for 2026-late to 2027 (initial coverage needs 578+ satellites). Amazon treats this as a balance-sheet optionality bet; it can fund the capital but has not yet demonstrated the economics.
- Eutelsat OneWeb — the only fully operational Western number-two, but it closes only on government money. With 648 Gen1 satellites it is the only fully operational Western LEO broadband besides Starlink, but amid a €535M GEO legacy impairment and consolidated losses it cut Gen2 capex ~30% and leans on French, UK and Indian export-credit agencies and the EU IRIS² program (264 satellites, €2.1B). It does not close on independent commercial economics — it is sustained by government and sovereign demand.
- China Qianfan / Guowang — strategic deployment, not commercial profit. Against ~13,000–15,000 announced each, only ~350 total are deployed (~1%), far short of the ITU 10% milestone (2029) and 50% milestone (6,500 satellites by 2032). There are on-orbit thruster and gyro failures, a shortage of batch-launch rockets, and 300+ upper-stage debris fragments. The motive is not commercial profit but spectrum priority (ITU filings totaling ~200,000 satellites) and sovereign communications — it is not a commercial-unit-economics test.
Chinese deployment counts come from near-primary and secondary trackers and vary considerably by snapshot (2026-06: Qianfan ~162–200, Guowang ~190). The direction of announced ≠ deployed is firm, but the exact snapshot numbers are unverified.
4. The core question, tested — does cheap launch translate into multi-player profit? (falsifiable)
Narrowing Part 0’s three hypotheses with satellite-layer data:
- (a) Vertical-integration capture — best fit for current data. Only Starlink has demonstrated large-scale deployment, ~10.3M subscribers, a (reported) ~$4.42B segment operating profit and a positive segment FCF; the rest are stuck in deployment delay (Amazon Leo, FCC relief), government dependence (Eutelsat, IRIS²/export credit) or strategic deployment (China, ITU milestone shortfall). Starlink vertically integrates launch (Falcon 9), satellites, DTC (T-Mobile) and terminals, recycling the surplus internally. Falsifying condition: if Amazon Leo, Eutelsat or China demonstrates an independent commercial segment profit and sustained cash flow, (a) weakens. Not observed to date.
- (b) Broad, durable multi-player economy — weakly supported (latent demand exists). DTC, sovereign communications and remote broadband demand are real, and the West (Eutelsat), China (Guowang/Qianfan) and Amazon are each building constellations. But no one outside Starlink has yet demonstrated a segment profit; Amazon is pre-commercial, Eutelsat is government-dependent, China is strategic. Strengthening condition: multiple constellations completing deployment within FCC/ITU deadlines plus each showing segment profit and effective demand. Not met.
- (c) Bubble and correction leaving a few survivors — partial signals. The SpaceX valuation debate (“only 7% real”), ARPU decline, terminal-cost disadvantage, Amazon deployment delay, and Chinese debris/technical failures suggest capital running ahead of demand and execution. But Starlink’s demonstrated segment cash flow weakens a “total bubble” reading. Partially unresolved.
Current provisional position: (a) fits the data best. Cheap launch has translated into large-scale cash flow only for the vertically integrated player (Starlink) — and even that is on private, reported figures — while the rest are blocked at the outcome layer. Part 2 does not conclude definitively, but it does refute the narrative that “mega-constellations are already a large, profitable multi-player business” — only one has demonstrated a segment profit, and that on unverified private figures.
5. Commercialization and competitive context (capital intensity, TRL)
- The capex treadmill vs segment cash flow. Because satellites last ~5 years, a constellation always needs replenishment launches — the structure of the treadmill. Starlink (on reported figures) is the only one past it, because it internalizes launch. Amazon Leo is pre-treadmill with large front-loaded capex bought externally; Eutelsat funds its treadmill with government money and defers capex by extending Gen1 life; for China, commercial FCF is not even the objective — the physical ceiling is rocket supply and debris.
- Starlink / SpaceX (private): the only constellation with demonstrated large-scale deployment, a reported segment profit and positive segment FCF — but every financial is unverified (reported S-1 / analyst estimate). The ~$1.75T valuation and IPO outlook are hype-contested.
- Amazon Leo / Amazon (AMZN): can fund the capital from the balance sheet, but has not demonstrated the economics; ~1% deployed, no revenue, FCC relief granted.
- Eutelsat OneWeb / Eutelsat (ETL.PA): the only fully operational Western number-two, but closing only on EU / export-credit money after a Gen2 capex cut.
- China Qianfan (SSST) / Guowang (China SatNet): state actors, ~1% deployed, strategic (spectrum priority, sovereign communications) rather than commercial.
- Company statements here are factual, neutral and source-attributed; competitive or deployment-ranking statements are not buy/sell implications for any security. Starlink financial magnitudes are unverified in detail.
6. The skeptic’s bottom line
- Announced ≠ deployed: Amazon Leo ~400 of 3,236, China ~350 of ~15,000+ each, Chinese ITU filings ~200,000 (a spectrum-priority instrument, not a build plan). The pattern is firm at the satellite layer.
- Every Starlink financial is unverified: subscribers, revenue, operating income, EBITDA and segment capex are from a reported SpaceX S-1 or analyst estimates that could not be independently confirmed on SEC EDGAR. Direction is consistent across outlets; absolute values are not primary-confirmed.
- Do not misread the group loss: SpaceX’s consolidated ~$2.59B operating loss is driven by AI/xAI capex (~$12.7B), not by Starlink. The group loss must be separated from the Starlink segment profit; the S-1 may be a merged entity.
- Segment FCF is a vertical-integration artifact: the positive segment FCF follows from internalized launch and does not apply to competitors that must buy launch externally.
- Neutral-framing note: the provisional “only Starlink has demonstrated a segment profit” conclusion must not be read as a negative on any competitor security — it is a neutral, source-attributed description.
7. What to watch (falsifiable)
- P1 — independent segment profit: if Amazon Leo (after commercial launch), Eutelsat (Gen2) or a Chinese operator demonstrates an independent commercial segment profit and sustained cash flow excluding government anchors and sovereign contracts, hypothesis (b) strengthens. If they stay government-dependent or deployment-delayed, (a) is confirmed. (Check: Amazon Leo commercial-launch financials, Eutelsat IR, Part 3.)
- P2 — deployment rate and FCC/ITU deadlines: if Amazon Leo reaches actual deployment, service and profit within the relaxed FCC deadline and China meets its ITU 10% milestone (2029), (b)/(c) weaken. If multiple players miss deadlines and rocket/debris friction keeps delaying deployment, (c) strengthens. (Check: FCC/ITU filings, Part 4.)
- P3 — private verification and Starship dependence: if a SpaceX IPO or additional disclosure independently confirms the Starlink segment profit and FCF in a primary document, (a)’s basis firms up; conversely, if ARPU decline, terminal cost and Starship delay compress the segment margin, treadmill risk returns. Meanwhile orbital congestion and debris raise cross-domain demand for quantum inertial navigation (GPS-denied) and ground-station compute (downlink/backhaul). (Check: SpaceX disclosure, ESA orbital environment, Parts 4–5.)
References
- TheNextWeb. “Starlink is SpaceX’s cash machine — but the maths is getting harder” (ARPU decline, terminal cost, operating income barely moved). https://thenextweb.com/news/starlink-is-spacexs-cash-machine-but-the-maths-is-getting-harder
- New Space Economy. 2026. “What is Starlink’s financial performance?” (reported S-1 revenue/EBITDA/segment capex). https://newspaceeconomy.ca/2026/05/30/what-is-starlinks-financial-performance/
- Wikipedia. “Starlink” (operational satellite count, public orbital catalog). https://en.wikipedia.org/wiki/Starlink
- About Amazon. “Project Kuiper / Amazon Leo satellite and rocket launch progress updates” (deployed missions, launch procurement). https://www.aboutamazon.com/news/innovation-at-amazon/project-kuiper-satellite-rocket-launch-progress-updates
- GeekWire. 2026. “FCC gives Amazon Leo more leeway on its satellite deployment schedule” (FCC milestone relief). https://www.geekwire.com/2026/fcc-gives-amazon-leo-more-leeway-on-its-satellite-deployment-schedule/
- Wikipedia. “Amazon Leo” (announced/authorized fleet, beta timing). https://en.wikipedia.org/wiki/Amazon_Leo
- Space Intel Report. “Eutelsat spending $2.3B for 440 OneWeb Gen-1 follow-ons, $2.1B for 264 IRIS² LEOs, hunts for export-credit financing” (Gen2 capex cut, export credit). https://www.spaceintelreport.com/eutelsat-spending-2-3b-for-440-oneweb-gen-1-follow-ons-2-1b-for-264-iris2-leos-hunts-for-export-credit-financing/
- SpaceNews. “China files ITU paperwork for megaconstellations totaling nearly 200,000 satellites” (spectrum-priority filings). https://spacenews.com/china-files-itu-paperwork-for-megaconstellations-totaling-nearly-200000-satellites/
- Orbital Radar. “Guowang / Qianfan” (deployment counts, milestone shortfall, debris/technical failures). https://orbitalradar.com/satellite-internet/guowang-qianfan
- T-Mobile. “Satellite phone service” (T-Satellite / Starlink direct-to-cell). https://www.t-mobile.com/coverage/satellite-phone-service
Disclosure
This post is for information only and is not investment advice.
COI note: this post describes private companies (SpaceX/Starlink SPCX; Amazon Leo, formerly Kuiper) and listed companies (Amazon AMZN; Eutelsat ETL.PA, parent of OneWeb; T-Mobile TMUS), plus Chinese state actors (Qianfan / SSST; Guowang / China SatNet), in a descriptive, neutral context. Every satellite count, subscriber, revenue, margin and capex figure is attributed to its source and separated into company claim, agency data (FCC, ITU, Eutelsat IR) and analyst/trade-press estimate. Starlink/SpaceX financials (revenue ~$11.39B, operating income ~$4.42B, EBITDA ~$7.17B, segment capex ~$4.18B, subscribers ~10.3M) are from a reported private-era SpaceX S-1 or analyst estimates and could not be independently confirmed on SEC EDGAR — they are stated as unverified. Announced does not equal deployed does not equal operational does not equal profitable. Quantitative claims are attributed to the vendor, author or preprint/report. Company and deployment statements are factual, neutral descriptions and are not buy/sell implications for any security. The author holds no position in, and has no financial interest in, the entities named.


Leave a Reply