Evidence-first notes on bioscience and deep tech, at the edge of the lab and the market. Information only — not investment advice. Public-company financials are attributed to SEC filings (primary); Starlink segment economics are attributed to reporting on a private company and to analyst estimates (pending post-IPO audited financials). All orbital-environment, debris and spectrum figures are attributed to ESA, NASA, FCC, ITU or GAO, and “announced (a filing)” is kept distinct from “deployed.”
The 30-second version
- What. Launch cost ($/kg to orbit) has genuinely collapsed — reusable Falcon 9 is roughly 90% below Shuttle-era cost (demonstrated). But cost-to-orbit is not the binding constraint any more. On the outcome layer the ceiling has moved to four other limits: (1) sustainable unit economics, (2) orbital debris and congestion, (3) spectrum and regulation, and (4) real demand.
- So what. Cheap launch does not guarantee a profitable space business. Every public pure-play outside Starlink and government contracts is posting GAAP net losses — Rocket Lab (RKLB) $(198.2)M, Planet (PL) $(246.9)M (of which ~$161M is a non-cash warrant remeasurement), AST SpaceMobile (ASTS) $(341.9)M, and Intuitive Machines (LUNR) $(106.8)M with revenue down 8% on a single NASA task-order cancellation. Virgin Orbit was liquidated, Astra was delisted, and Momentus carries a going-concern flag. Starlink is the lone at-scale profit, and that figure is reported/estimated on a private company, pending post-IPO audited financials.
- Now what. The other three ceilings are already operational, not far-future theory. ESA counts ~140M debris objects in the 1mm–1cm band and ~40,000 tracked; Starlink logged roughly 300,000 collision-avoidance maneuvers across full-year 2025 (+50% year over year). The FCC 5-year deorbit rule (FCC 22-74) is in force, and China filed with the ITU for 193,428 satellites — a spectrum/orbit land-grab, not a deployment plan. On spectrum, the ITU Article 22 EPFD limits govern single-entry interference but the aggregate case is unresolved and pushed to WRC-27, while landing rights remain country-by-country (India froze Starlink’s commercial launch in June 2026). And demand looks supply-led: the strongest demand-pull candidate is data-center backhaul for computing power.
The five-minute read
Two claims that are not the same — cheap launch, and a profitable business
The firm’s recurring lens — “the headline is the starting point; the real bottleneck is elsewhere” — is at its sharpest in space. The headline, the collapse of $/kg to orbit, is real and demonstrated. But the moment launch cost fell on the outcome layer, the binding constraint moved off launch cost and onto four other ceilings. Fiscal-year 2025 data make the first ceiling concrete: outside Starlink (private) and government contracts, the public pure-plays are, without exception, running GAAP net losses even as revenue grows. Launch got cheaper; that lowered the entry threshold, but it did not replace sustainable unit economics as the thing that decides whether the business clears.
The cost-to-orbit era did not filter out failure. Virgin Orbit filed Chapter 11 in April 2023 and was liquidated; Astra was delisted from Nasdaq in July 2024 and taken private at $0.50/share after a SPAC value near $2.6B collapsed to about $13M; Momentus (MNTS) carries a going-concern flag with $0.1M of cash at mid-2025; Virgin Galactic (SPCE) burns roughly $100M a quarter against near-zero revenue. These are outcome-layer facts, attributed to court, exchange and SEC records — and they refute the idea that cheaper launch equals a profitable space business.
The other three ceilings are already operational, not theory
The orbital environment is a present-day operating cost, not a distant hypothetical. ESA’s live DISCOS statistics count roughly 54,000 objects larger than 10cm (of which ~40,000 are actually catalogued and tracked), ~1.2M in the 1–10cm band, and ~140M in the 1mm–1cm band, with more than 16,600 tonnes in orbit. Starlink’s own FCC semiannual reporting cites roughly 300,000 avoidance maneuvers across calendar 2025, up about 50% from ~200,000 in 2024 — roughly 40 maneuvers per satellite per year, at a very conservative 3-in-10-million collision-probability threshold. The FCC’s 5-year deorbit rule (FCC 22-74) applies to new applications since September 2024, and China’s ITU filing (CTC-1 plus CTC-2, 96,714 each = 193,428 satellites) illustrates the extreme of “announced (filing) is not deployed” — a defensive spectrum/orbit reservation, not a build plan (deploying that many within seven years would require roughly 500 launches per week). On spectrum, the ITU Article 22 EPFD limits regulate single-entry interference into GSO networks, but whether aggregate interference from many megaconstellations stays within intent is unresolved and was deferred to WRC-27; and landing rights are granted country-by-country, so an ITU filing plus a home license does not equal market access (India froze Starlink’s final commercial approval in June 2026).
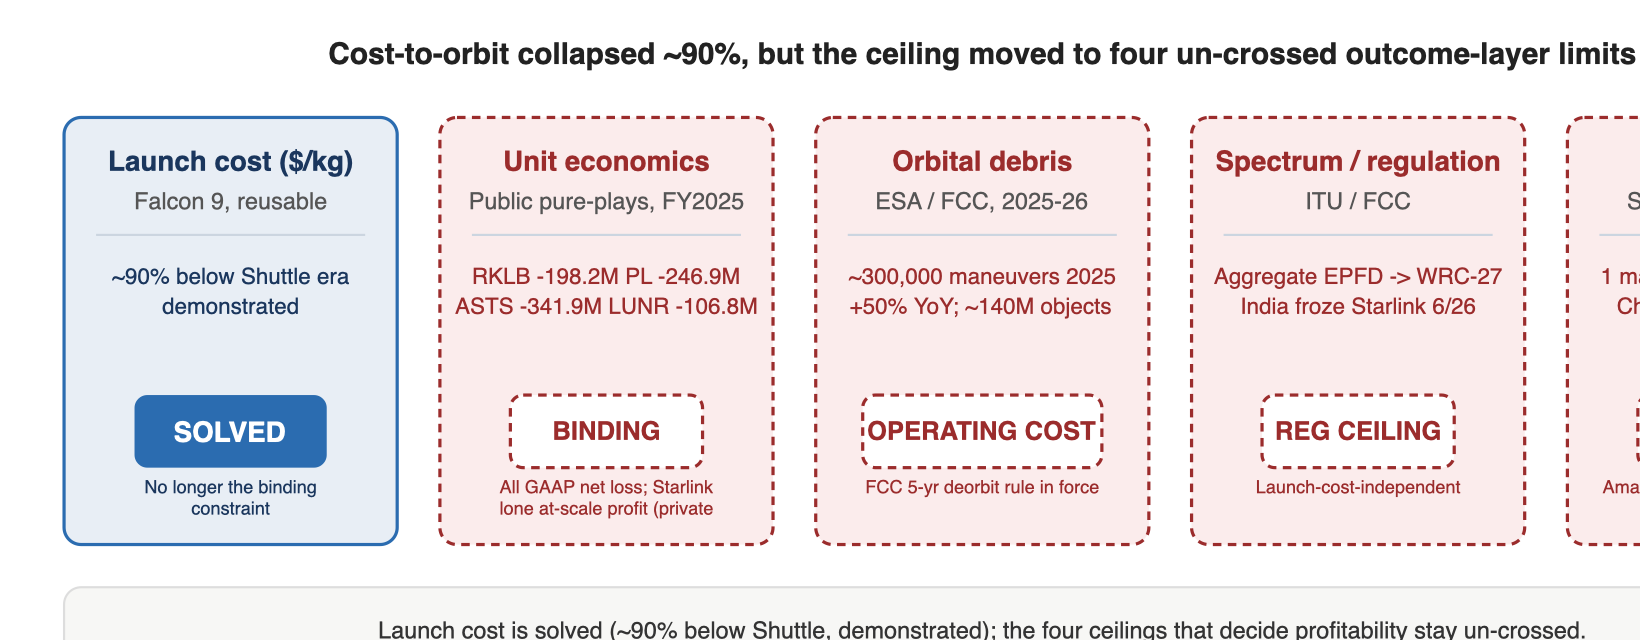
| Outcome-layer ceiling | Status (2026, attributed) | Verdict |
|---|---|---|
| 1. Sustainable unit economics | Every public pure-play outside Starlink/government at a GAAP net loss — RKLB $(198.2)M, PL $(246.9)M (~$161M non-cash warrant), ASTS $(341.9)M, LUNR $(106.8)M (revenue -8% on NASA cancellation); Virgin Orbit liquidated, Astra delisted, Momentus going-concern (SEC/court) | Binding — Starlink is the lone at-scale profit (private, estimated) |
| 2. Orbital debris / sustainability | ESA ~140M objects 1mm–1cm, ~40,000 tracked; Starlink ~300,000 avoidance maneuvers full-year 2025 (+50% YoY); FCC 5-year deorbit (FCC 22-74); China ITU filing 193,428 satellites (ESA/FCC/ITU) | Present-day operating cost, not theory |
| 3. Spectrum / regulation | ITU Art.22 EPFD governs single-entry; aggregate unresolved → WRC-27; landing-rights friction (India froze Starlink June 2026); FCC SCS emission limits (ITU/FCC) | Regulatory ceiling, launch-cost-independent |
| 4. Real demand | One mass paying market (broadband); everything else government/defense-anchored or pre-commercial. Supply-led signals: China filings = spectrum-staking; Amazon Leo pre-revenue >$10B procured; strongest demand-pull = data-center backhaul | Supply-led this cycle |
Deep dive
1. Background — announced is not deployed is not operational is not profitable
Across the launch, satellite and application layers, the same gap recurs: announced is not deployed, deployed is not operational, and operational is not profitable. The headline of the domain is the collapse of $/kg to orbit — reusable Falcon 9 at roughly 90% below Shuttle-era cost, demonstrated. But once that collapse landed on the outcome layer, it opened the upstream without settling the ceiling on a “large, multi-player space economy.” The binding constraint moved from launch cost itself to four outcome-layer limits: sustainable unit economics, orbital sustainability, spectrum/regulation and real demand. The central falsifiable claim of this part is that these four together — not launch cost — now set the ceiling, which supports a picture of single vertically-integrated capture coexisting with a correction rather than a broad, many-winner economy.
2. What this establishes — unit economics: cheap launch, mostly losses (SEC primary)
“Launch got cheaper” and “space companies are profitable” are entirely different propositions. The fiscal-2025 outcome-layer data show that outside Starlink (private) and government contracts, most public pure-plays post GAAP net losses. Revenue is attributed and government-anchored demand is separated from commercial-market demand where possible.
| Company (ticker) | FY2025 revenue (attributed) | GAAP net loss | Demand character / source |
|---|---|---|---|
| Rocket Lab (RKLB) | $601.8M (+38%) | $(198.2)M (operating loss $(228.8)M; Adj EBITDA $(101.2)M) | Government (DoD/NASA) + commercial; backlog $1.85B (+73%) — SEC 8-K/10-K |
| Planet Labs (PL, FY2026) | $307.7M (+26%) | $(246.9)M (of which ~$161.4M is a non-cash warrant remeasurement) | Defense/intelligence anchor (D&I +50%); first Adj EBITDA ($15.5M) and FCF-positive year — SEC 8-K |
| AST SpaceMobile (ASTS) | $70.9M (2024 ~$4.4M) | $(341.9)M (opex $358.6M) | MNO + US government (pre-commercial); ~$2.8B cash liquidity — SEC 10-K |
| Intuitive Machines (LUNR) | $210.1M (-8% YoY) | $(106.8)M (FCF -$56.0M) | NASA anchor near 100%; OMES III cancellation -$71.9M — SEC 10-K |
LUNR is the textbook case that a government anchor both sustains and destabilizes demand: fiscal-2025 revenue fell 8% because NASA cancelled the OMES III / OSAM task order (-$71.9M), only partly offset by CLPS (+$25.3M) and NSN (+$16.8M). The stranded set — Virgin Orbit’s liquidation, Astra’s delisting and cumulative losses above $750M, Momentus’s going-concern flag, Virgin Galactic’s cash burn — did not fail on launch cost but on unit economics, demand, timing and capital. This mirrors an execution-and-demand risk seen elsewhere in the firm’s work: good cells and abundant capital do not, by themselves, solve GWh-scale yield.
Space insurance is a separate unit-economics signal, and a weaker one evidentially (trade/broker secondary): reporting cites a record net insurance loss around $(438)M in 2023 (claims ~$995M against premium ~$557M), driven by the ViaSat-3 Americas (~$445M) and Inmarsat 6-F2 (~$348M) claims, with GEO/Falcon-9 launch-plus-one-year rates rising by roughly 85–135% at 2024 renewal. The direction is consistent across outlets; the absolute figures vary by source and are treated as unverified.
The lone exception is Starlink. Reporting and estimates put Starlink at FCF-positive from 2024, revenue rising from ~$7.7B (2024) to ~$11.4B (2025, about 61% of SpaceX’s total), operating income around $4.4B (2025) at roughly 63% margin. Those segment figures are reporting on a private company and analyst estimates, and cannot be independently confirmed until an audited 10-K follows the June 2026 IPO — treated as unverified. The engine is recurring-revenue broadband, and the vertical-integration advantage of self-launch (Falcon 9) underwrites the unit economics — cheap launch turned downstream profitable only for the party that internalized launch.
3. Orbital debris and congestion — the physical ceiling (ESA/NASA/FCC/GAO primary)
The second binding constraint is the orbital environment, and it is a present-day operating burden, not a far-future theory. ESA’s Space Environment Report 2025 and live DISCOS statistics (2026 snapshot) count roughly 54,000 objects above 10cm (about 40,000 actually catalogued and tracked), ~1.2M in the 1–10cm band (untrackable but capable of catastrophic damage), and ~140M in the 1mm–1cm band, with more than 16,600 tonnes in orbit. Note a self-correcting flag: ESA’s tally of active payloads (~9,300) lags the real fleet — Starlink alone already exceeds ~10,700 — so the institutional number is if anything conservative and dated; there is no single precise count of operational satellites (a ~15,000 estimate, Starlink ~65%, is unverified).
Congestion is already an operating cost. Starlink’s FCC semiannual reporting (cited) indicates roughly 300,000 avoidance maneuvers across calendar 2025, up ~50% from ~200,000 in 2024 — about 40 maneuvers per satellite per year, triggered at a 3-in-10-million collision threshold far more conservative than the 1-in-10,000 industry norm. The industry-wide conjunction-alert total has no single authoritative figure (LeoLabs and Slingshot hold partial data) and is unverified; the Starlink figures are self-reported via SpaceX’s FCC filings. The Kessler syndrome (the collision-cascade model, Kessler & Cour-Palais, JGR 83(A6):2637, 1978, NASA) describes how, above a critical debris density, collisions generate debris that feed further collisions. There is, however, no institutional consensus that a cascade is “already underway” (unverified): NASA/ESA models show that the ~700–1,000km band is supercritical (population would grow even with zero new launches), which is standard framing, not a declaration of a runaway cascade.
Three regulatory limits bound growth. The FCC 5-year deorbit rule (FCC 22-74, adopted 4-0 on 29 September 2022) requires end-of-life disposal as soon as practicable and no later than five years after mission end for LEO, applied to new applications since 29 September 2024 — which, combined with 5-year satellite lifetimes, intensifies the capex treadmill. China’s ITU filing (CTC-1 plus CTC-2, 96,714 each = 193,428 satellites, December 2025) is a priority-reservation filing, not a deployment plan (the historical record single filing is Rwanda’s Cinnamon-937 at 337,320, 2021). And GAO-22-105166 catalogues debris, upper-atmosphere emissions/ozone and astronomy interference from large constellations, noting ~5,500 active satellites in spring 2022 against external estimates of +58,000 by 2030. Orbital sustainability is thus a physical ceiling on growth, and the spectrum/orbit land-grab incentive can pull debris risk forward.
4. Spectrum and regulation — the regulatory ceiling (ITU/FCC primary)
The third binding constraint is spectrum and regulation: even at zero launch cost, no usable frequency, orbital slot or market access means no service. The ITU Radio Regulations Article 22 EPFD (equivalent power flux-density) limits cap the interference a non-geostationary (NGSO) FSS system may impose on geostationary (GSO) networks in shared Ku/Ka bands, verified via ITU EPFD software (Resolution 85). The key unresolved point is that today’s limits are single-entry (per-system): whether aggregate interference stays within GSO-protection intent when many megaconstellations operate at once is unresolved — WRC-23 reaffirmed the single-entry limits, declined to revise thresholds, and moved aggregate EPFD to a WRC-27 (Shanghai, 2027) study item. So “EPFD already governs megaconstellation interference” is partly true (single-entry) and unresolved (aggregate).
ITU coordination is first-come, first-served by filing date (the Master International Frequency Register), which motivates China’s ~200,000-satellite defensive filing. The NGSO deployment milestones (Resolution 35, WRC-19) require 10% of notified satellites within 2 years, 50% within 5, and 100% within 7 — clocked from the end of the RR No.11.44 seven-year regulatory period — to prevent spectrum warehousing. Nationally, the FCC (US license, Part 25) and the ITU (international coordination) are both required; the FCC allocates NGSO FSS spectrum in processing rounds (the 2020 Ku/Ka round drew about ten applicants including Kuiper, SpaceX Gen2 and OneWeb), so Starlink and Kuiper hold co-equal priority from the same round with mutual coordination duties, under interference thresholds of 3% time-weighted throughput degradation (long-term) and ≤0.4% link-unavailability increase (short-term, FCC 20-102).
Market access is separate again. An ITU filing plus a home license does not permit sales abroad — each country grants landing rights individually. India illustrates the friction: Starlink obtained a GMPCS license around mid-2025, but in June 2026 India’s home-ministry security agencies froze the final approval needed to launch commercially (terminal-control concerns amid a regional conflict), and service had not started as of July 2026. Italy shows a slower version: operating since 2021 (~55,000 customers under AGCOM), an E-band expansion request has been stalled roughly two years over EU spectrum decisions and incumbent-operator objections. Finally, direct-to-cell adds a spectrum contest: the FCC’s Supplemental Coverage from Space order (FCC 24-28, 14 March 2024) lets satellite operators lease terrestrial mobile flexible-use spectrum to fill dead zones, with an aggregate out-of-band-emission PFD limit of -120 dBW/m²/MHz to protect adjacent terrestrial operators — a limit SpaceX obtained a waiver against as too restrictive, with AST the main competing SCS player. Spectrum and regulation therefore form a growth ceiling independent of launch cost.
5. Demand-side reality — is this supply-led? (inheriting the application layer)
The fourth and most fundamental constraint is real demand. The application-layer analysis narrowed the five uses (Earth observation, broadband, direct-to-cell, PNT, in-space) to demonstration stage and concluded that outside broadband the picture is supply-rich and revenue-thin, and even the paying segments are government/defense-anchored. Compressed to an outcome-layer proposition: is this buildout demand-pull or supply-led? The one mass paying market is broadband (Starlink), and even that rests on private estimates. Where money does appear in Earth observation, it is government and defense (Planet D&I +50% YoY; ICEYE’s German Bundeswehr contract of about €1.76B) — and the financials confirm it, since PL and LUNR growth is government-driven and LUNR fell 8% on a government cancellation. Direct-to-cell and in-space remain pre-commercial or demonstrated-not-profitable (AST still lacks continuous service, needing 45–60 satellites).
The supply-led signals are three: China’s ~193,428-satellite ITU filing is motivated by spectrum-staking rather than demand; Amazon Leo has procured more than $10B of launch before commercial service (pre-revenue, large supply committed ahead of demand); and the net losses and capex treadmill in section 2 describe revenue (demand) failing to keep up with capex (supply). The open demand-pull counter is real, though: remote broadband, sovereign communications, defense EO, GPS-denied PNT and data-center backhaul (the computing-power cross-domain link) are genuine demand, and if any of them translates beyond government anchors into large-scale commercial demand, the diagnosis could flip. For now demand converges on one broadband market plus government anchors — so at least this cycle’s buildout looks closer to supply-led than demand-pull.
6. The skeptic’s bottom line
- Cheap launch is not a profitable business: refuted the claim directly — outside Starlink and government contracts the public pure-plays run GAAP net losses (RKLB, PL, ASTS, LUNR), and Virgin Orbit/Astra/Momentus/Virgin Galactic show the failure set. Launch cost lowered the threshold; it did not replace unit economics.
- Debris is not a far-future theory: refuted — ~300,000 avoidance maneuvers across 2025 (+50% YoY), about 40 per satellite per year, plus the FCC 5-year rule, China’s 193,428-satellite filing and rising insurance rates are already pricing expansion cost.
- Starlink’s economics are a private estimate: revenue ~$11.4B, ~63% margin, FCF-positive are reporting and analyst estimates, not independently confirmable until an audited 10-K follows the June 2026 IPO.
- Self-reported and unadjudicated items: Starlink’s maneuver counts are SpaceX FCC self-reporting; “Kessler cascade already underway” has no institutional consensus (distinct from supercritical-band framing); aggregate EPFD adequacy, the industry conjunction total and absolute insurance figures are unresolved.
- Net loss is not a verdict of failure: GAAP losses mix non-cash items (PL’s ~$161.4M warrant remeasurement) and growth-stage capex; individual-security success/failure must not be inferred. Company statements here are factual, neutral and source-attributed — not buy/sell implications for any security.
7. What to watch (falsifiable)
- P1 — independent profit / demand-pull: if, in 2026–2028, multiple public pure-plays outside Starlink reach GAAP profit, or large-scale commercial demand beyond broadband-plus-government is demonstrated, the bottleneck eases toward a broad multi-player economy. Persistent net losses, government dependence and supply-led signals point the other way. (Watch: RKLB/PL/ASTS/LUNR subsequent filings, commercial-revenue share.)
- P2 — orbital-sustainability ceiling: if avoidance maneuvers, debris, the 5-year deorbit rule and insurance rates actually raise megaconstellation expansion and regulatory cost enough to bend deployment pace or economics, the correction thesis strengthens; if the FCC/ITU regulate aggregate interference and debris yet deployment continues, the ceiling is not binding. (Watch: ESA orbital-environment follow-ups, maneuver trend, insurance rates, the WRC-27 aggregate-EPFD decision.)
- P3 — spectrum × demand × cross-domain: if aggregate-EPFD limits or landing-rights denials block expansion, the correction thesis strengthens — while rising orbital congestion and GNSS vulnerability push demand toward quantum inertial navigation, and megaconstellation/EO downlink push demand toward ground-station compute and data-center power. Conversely, if data-center backhaul or remote AI power becomes a new mass demand source for satellite broadband, the demand-pull case is re-rated. (Watch: WRC-27, quantum-PNT contracts, data-center backhaul demand signals.)
References
- ESA. 2025. “ESA Space Environment Report 2025” (April 2025, data end-2024). https://www.esa.int/Space_Safety/Space_Debris/ESA_Space_Environment_Report_2025
- ESA. DISCOSweb statistics (live; 2026 snapshot: >10cm ~54,000; 1–10cm ~1.2M; 1mm–1cm ~140M; total mass >16,600t). https://sdup.esoc.esa.int/discosweb/statistics/
- Kessler, D. J., and B. G. Cour-Palais. 1978. “Collision Frequency of Artificial Satellites: The Creation of a Debris Belt.” Journal of Geophysical Research 83(A6):2637 (Kessler syndrome origin). https://ntrs.nasa.gov/citations/19780057167
- FCC. 2022. “FCC Adopts New ‘5-Year Rule’ for Deorbiting Satellites” (FCC 22-74; IB Docket 22-271/18-313; new applications from 29 September 2024). https://www.fcc.gov/document/fcc-adopts-new-5-year-rule-deorbiting-satellites-0
- GAO. 2022. “Large Constellations of Satellites: Mitigating Environmental and Other Effects” (GAO-22-105166). https://www.gao.gov/products/gao-22-105166
- ITU. Resolution 35 (WRC-19). NGSO deployment milestones 10%/2yr, 50%/5yr, 100%/7yr. https://www.itu.int/en/ITU-R/space/Documents/RES35(WRC-19).pdf
- FCC. 2024. “Supplemental Coverage from Space (SCS) Report and Order” (FCC 24-28; 14 March 2024; OOBE PFD -120 dBW/m²/MHz). https://docs.fcc.gov/public/attachments/FCC-24-28A1.pdf
- SpaceNews. 2025. “China Files ITU Paperwork for Megaconstellations Totaling Nearly 200,000 Satellites” (CTC-1 + CTC-2, 96,714 each = 193,428). https://spacenews.com/china-files-itu-paperwork-for-megaconstellations-totaling-nearly-200000-satellites/
- Rocket Lab. FY2025 8-K (revenue $601.8M; GAAP net loss $198.2M; backlog $1.85B). SEC. https://www.sec.gov/Archives/edgar/data/1819994/000181999426000012/rklb-02262026ex991.htm
- Intuitive Machines. FY2025 10-K (revenue $210.1M, -8% YoY; GAAP net loss $106.8M). SEC. https://www.sec.gov/Archives/edgar/data/1844452/000162828026019865/lunr-20251231.htm
- SpaceNews. 2023. “Virgin Orbit Files for Bankruptcy” (Chapter 11, 4 April 2023; liquidation). https://spacenews.com/virgin-orbit-files-for-bankruptcy/
- SatelliteToday / Slingshot Aerospace. 2024. “Record Insurance Losses in 2023” (~$438M net loss; ViaSat-3 ~$445M). https://www.satellitetoday.com/sustainability/2024/05/01/slingshot-aerospace-reveals-record-insurance-losses-in-2023-in-new-satellite-deployments-report/
Disclosure
This post is for information only and is not investment advice.
COI note: this post describes listed companies (Rocket Lab RKLB, Planet Labs PL, AST SpaceMobile ASTS, Intuitive Machines LUNR, Virgin Galactic SPCE, Momentus MNTS, Astra ASTR [delisted]), a bankruptcy/liquidation (Virgin Orbit) and a private/newly-listing entity (SpaceX/Starlink) in a descriptive, neutral, unit-economics, orbital-environment and regulatory context. Financials are attributed separately to SEC filings (primary) and to reporting/estimates on private companies; government-contract revenue is distinguished from commercial-market revenue where possible. Net losses, bankruptcies and delistings are cited only as public facts and are not extended into negative implications for any security. All orbital, debris and spectrum figures are attributed to ESA, NASA, FCC, ITU and GAO, and “announced (a filing)” is kept distinct from “deployed.” Quantitative claims are attributed to the vendor, author or reporting/estimate as noted. Agencies referenced (ESA, FCC, ITU) are regulatory or scientific bodies. This is not a solicitation to buy or sell, and is not investment advice. The author holds no position in, and has no financial interest in, the companies named.


Leave a Reply