Evidence-first notes on bioscience and deep tech, at the edge of the lab and the market. Information only — not investment advice. All revenue, valuation and market-size figures are attributed to the filing, announcement or trade-press aggregate they come from; company claims, agency data, analyst estimates and press reports are separated inline. Marketed $/kg is not internal cost; announced is not deployed is not profitable.
The 30-second version
- What. The launch-cost headline is real — Falcon 9 reuse cut $/kg roughly 90% versus the Shuttle era. But the paradox is that the domain generating the headline (cheap launch) and the player winning at the outcome layer (durable profit and real downstream demand) have split apart, and at the outcome layer only one player has demonstrated large-scale deployment and cash flow: SpaceX, which vertically integrates launch (Falcon 9) and satellites (Starlink). ★ On 12 June 2026, SpaceX IPO’d on Nasdaq under the ticker SPCX (reported fixed price $135, ~555.6M shares, ~$75B raised, implied valuation ~$1.77T — reported as the largest US IPO on record). Starlink is reported at roughly two-thirds of SpaceX revenue.
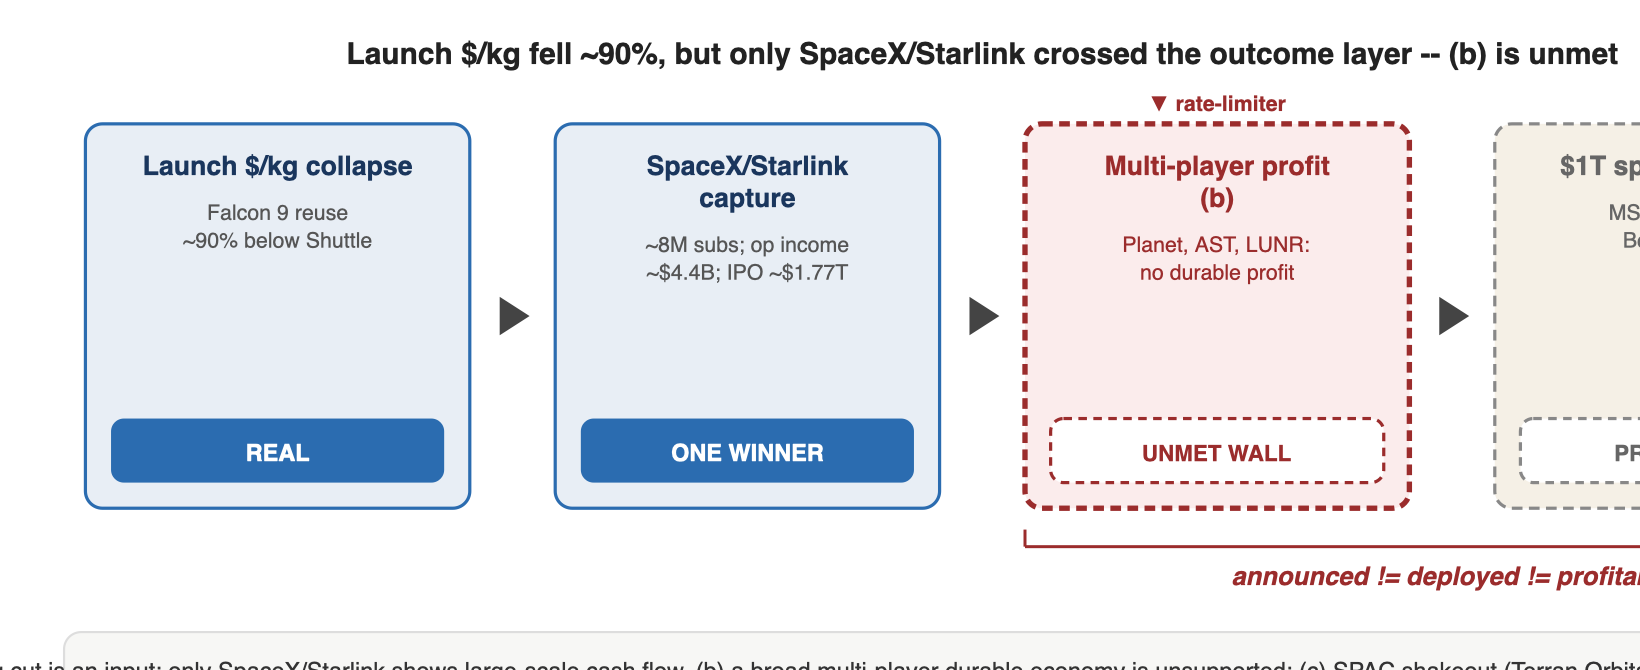
- So what. The cheap-launch surplus is circulating into a single vertically-integrated winner, not a broad multi-player economy. The very same June-2026 IPO rotated capital toward SpaceX and drove Rocket Lab (RKLB), Planet (PL), Intuitive Machines (LUNR), AST SpaceMobile (ASTS), Redwire and Momentus down in tandem (trade press). Independent downstream players are thin on profit and effective demand: Planet’s profitability is deferred, AST is pre-commercial, LUNR had a partial mission failure. This is not a security judgment on any name — the co-movement is a capital-flow signal, not a verdict on fundamentals.
- Now what. The center of gravity in the current data sits on hypothesis (a) — single vertically-integrated capture — with (c) bubble/shakeout co-present (Terran Orbital delisted into a Lockheed acquisition, Virgin Orbit bankrupt, Astra delisted ~98% down). Hypothesis (b), a broad durable multi-player economy, is unsupported this cycle. Watch whether independent downstream players ever reach durable profit, and treat the ~$1.77T valuation as a price on future expectations, not a multiple of current earnings.
The five-minute read
A market where the headline domain and the outcome-layer winner have split
The space economy’s commercial paradox mirrors energy-storage’s “the chemistry that wins the lab spec is not the chemistry that wins the GWh (LFP).” The domain generating the headline (launch $/kg collapse — Falcon 9 reuse cut cost roughly 90% versus the Shuttle era, real) is separate from the player that actually won at the outcome layer (durable profit, downstream effective demand). And at the outcome layer the winner is effectively one — SpaceX, which vertically integrates launch (Falcon 9) and satellites (Starlink).
The first half of 2026 made that split brutally visible. SpaceX listed on Nasdaq under SPCX on 12 June 2026 (CNBC reporting: fixed offer price $135, ~555.6M shares, ~$75B raised, implied valuation ~$1.77T, reported as the largest US IPO on record). Its engine is Starlink — reported 2025 revenue of roughly $10–11.4B (about two-thirds of total revenue), with ~8M subscribers as of November 2025, framed as SpaceX’s cash engine (Forbes/Trefis and S-1 reporting). The very same IPO pulled capital toward SpaceX and, per June-2026 trade press (“space stocks bleed,” “SpaceX steals the show”), Rocket Lab, Planet, Intuitive Machines, AST SpaceMobile, Redwire and Momentus fell in tandem. The cheap-launch surplus circulates into one vertically-integrated player, while the rest of the downstream is thin on profit or bleeding capital — a textbook realization of hypothesis (a).
The headline is nearly solved; the bottleneck is the outcome layer
Translated commercially, the firm’s recurring lens sharpens again: the headline is the “launch-cost war,” but the bottleneck is singular — sustainable unit economics and downstream effective demand (the outcome layer). Launch cost has already collapsed (Falcon 9), yet that collapse is translating not into a large multi-player space economy but into a single vertically-integrated winner plus a thin remainder. The table below lays out the commercial landscape by layer; every figure is attributed to a filing, an institutional aggregate or trade press.
| Layer / role | Company (ticker / status) | 2025–H1 2026 commercial position (attributed) | Source |
|---|---|---|---|
| Vertically-integrated winner (launch + satellites) | SpaceX (SPCX, Jun 2026 IPO) | Listed Nasdaq 12 Jun 2026; fixed $135, ~555.6M shares, ~$75B raised, implied ~$1.77T, reported largest US IPO. Valuation ladder $350B (Dec 2024 tender) → $400B (Jul 2025) → $800B (Dec 2025, $421/share) → ~$1.77T (IPO) | CNBC / Forbes (trade press) |
| Cash engine (satellite broadband) | Starlink (SpaceX segment) | 2025 revenue ~$10–11.4B (~2/3 of total); ~8M subscribers (Nov 2025); reported operating income ~$4.4B, while SpaceX group is described as GAAP loss-making | S-1 reporting / analyst (★ source conflict flagged) |
| Launch: listed small-to-medium | Rocket Lab (RKLB) | 2025 revenue $601.8M (+38%); Electron 21 flights, 100%; backlog $1.1B; Neutron maiden flight slipped to mid-2026; fell in the Jun-2026 SpaceX-IPO rotation | SEC 10-K (primary) |
| App: Earth observation (EO) | Planet Labs (PL) | FY2026 revenue ~$307.7M (+26%); profitability carried forward; fell in tandem Jun 2026 | Filing (primary) |
| App: direct-to-cell | AST SpaceMobile (ASTS) | 2025 revenue $70.9M (mostly gateway/government); 2026 guidance $150–200M; 45–60 satellites needed for continuous service; stock swings on launch/rotation news | SEC 8-K (primary) |
| App: cislunar / Moon | Intuitive Machines (LUNR) | IM-2 (Mar 2025) tipped over after landing (power shortfall); IM-2 contract revenue $131.2M; new CLPS $180.4M (Nova-D); fell in tandem Jun 2026 | SEC 10-K (primary) |
| App: in-space manufacturing / components | Redwire (RDW) | Space infrastructure / components; reported >20% drop in Jun 2026 (SpaceX-IPO rotation); pre / low-margin | Trade press (Benzinga etc.) |
| (SPAC-era cautionary) | Terran Orbital (fmr LLAP, delisted) | Acquired by Lockheed Martin at ~$606M enterprise value and delisted (smallsat maker absorbed) | Aviation Week |
| (SPAC-era cautionary) | Virgin Orbit (bankrupt); Astra (~98% down, delisted); Momentus (MNTS) | Virgin Orbit bankrupt; Astra delisted after ~98% decline; many 2019–21 SPAC space names taken private / wound down | Aviation Week / trade press |
| — | Market anchor | Space Foundation, The Space Report 2025 Q2: 2024 space economy $613B (+7.8%), 78% commercial; satellite services ~$108B; ground equipment ~$155B | Space Foundation (primary) |
Deep dive
1. Background — the domain that generates the headline vs the layer that captures value
The paradox restated: the launch-cost collapse ($/kg, Falcon 9 reuse ~90% below the Shuttle era) is real, but it is translating into a single vertically-integrated winner plus a thin remainder rather than a large multi-player space economy. Value in the space economy sits downstream and on the ground — Space Foundation puts satellite services at ~$108B and ground equipment at ~$155B, both far larger than launch, within a 2024 total of $613B. So “launch got cheap” is not the same as “the space economy got large” or “many independent players prospered.” Value capture is downstream, but the winner-plus-government-anchor takes it first, leaving independent pure-plays thin on profit and effective demand. This Part sweeps the commercial landscape, filters the divergent “$1T space economy” bank projections (a skeptic catch), resolves Part 0’s central question, and closes the six-Part series against the firm’s through-line.
2. What this landscape establishes — divergent “$1T space economy” projections are a skeptic catch
The domain’s signature hype anchor is the investment-bank claim that “the space economy reaches $1T.” That number diverges bank to bank on both timing and size, so it cannot be cited as a single fact — a skeptic catch.
- Morgan Stanley: today’s ~$350B space industry expands to $1T+ by 2040 (a tripling). (morganstanley.com)
- Citi: $1T by 2040 — timing matching Morgan Stanley. (CNBC 2022)
- Bank of America: more aggressive — $1T by 2030, and $3T+ by 2040 (a decade earlier on timing, 3x on size). (trade press)
- SpaceNews, “the trillion-dollar question”: the $1T projection has echoed across the industry for more than a decade, but methodology and definition (what counts as the “space economy”) differ, making the figures non-comparable. (spacenews.com)
Skeptic implication. Timing divergence (2030 vs 2040) and size divergence ($1T vs $3T) coexist — “$1T by 2040” is not a consensus fact but the midpoint of a wide projection band. A crucial internal inconsistency compounds this: McKinsey’s widely-cited “$1.8T by 2035” is internally inconsistent — the space “backbone” core is only ~$775B, and the $1.8T folds in “reach” applications (for example ride-hailing such as Uber) that merely use GPS rather than being space businesses. Counted that way, the headline number is inflated by definition, analogous to prior-series market-size catches (energy-storage market-size refuted, ATTR-series vendor-figure refuted). Projections are forecasts, not achievements; the measured anchor is Space Foundation’s 2024 $613B (institutional aggregate, 78% commercial). And most of the value sits in the ground and services layers (satellite services ~$108B, ground equipment ~$155B, far above launch), so “a $1T space economy” is not “a $1T of launch and constellations.” Verify the internal divergence first, then flag.
3. Synthesis — resolving Part 0’s three hypotheses
Part 0 juxtaposed three falsifiable hypotheses. Assembling the commercial, production and deployment evidence from Parts 1–5 shifts the center of gravity.
(a) Single vertically-integrated capture — ★ most strongly supported by current data. Only SpaceX/Starlink has demonstrated large-scale deployment and cash flow (Starlink ~$10–11.4B, ~8M subscribers, reported operating income ~$4.4B), circulating the cheap-launch surplus internally via launch (Falcon 9) + satellites (Starlink). The June-2026 SpaceX IPO (~$1.77T reported) pulled capital toward SpaceX while RKLB, PL, LUNR, ASTS, Redwire and Momentus fell in tandem — a direct capital-market signal that “one wins.” Independent downstream players are thin on profit and demand: Planet’s profitability deferred, AST pre-commercial (government/gateway), LUNR partial mission failure, Redwire volatile. The falsifying condition (multiple independent downstream players outside Starlink each reaching durable profit and large-scale effective demand) is not yet observed.
(b) A broad, durable multi-player economy — unsupported by current data. The listed launch challenger (Rocket Lab) is near profitability but faces a Neutron slip and a scale gap; downstream (Planet, AST, LUNR) has not reached durable profit or continuous service. Space Foundation’s $613B and $108B in satellite services show large value exists in the ground/services layers, but there is no evidence that value is realized as durable profit distributed across many independent players. Reassess if Rocket Lab Neutron proves out, Planet turns profitable, or AST reaches continuous service in 2027–2028 (falsifiability preserved).
(c) Bubble/shakeout with a durable few — early-to-middling evidence, co-present. A SPAC-era shakeout is measured: Terran Orbital delisted (Lockheed absorption ~$606M), Virgin Orbit bankrupt, Astra delisted after ~98% decline, Momentus/Redwire down >20% in June 2026, many 2019–21 SPAC names taken private or wound down — the extreme of “announced is not a durable business.” But the correction runs alongside concentration into the winner (SpaceX) rather than a whole-domain collapse, so (c) overlaps rather than excludes (a). Kessler/spectrum ceilings (Part 4) raising expansion cost would strengthen (c).
★ Resolution. The center of gravity in current data is (a) single vertically-integrated capture, with (c) bubble/shakeout co-present beneath it (“one wins, the rest correct”). (b) a broad durable multi-player economy is unsupported. The launch-cost collapse is real (Falcon 9 ~90%), but it is translating into “one vertically-integrated winner (SpaceX/Starlink) plus a thin or correcting remainder” rather than into a large durable multi-player economy. Cheap launch is not a broad multi-player space economy — at least the outcome-layer evidence of this cycle points that way. Part 0’s premise, that no downstream reached durable profit or large effective demand on cheap launch alone, is observed intact in the commercial landscape.
4. Verdict table
| Item | Status | Basis (attributed) |
|---|---|---|
| Launch-cost collapse (Falcon 9) | Demonstrated | Reuse ~$2,700–3,000/kg, ~90% below Shuttle (Part 0, trade press) |
| Single vertically-integrated capture (a) | Demonstrated / strengthened | SpaceX/Starlink the only large-scale cash flow; other space names fell in the Jun-2026 IPO rotation |
| SpaceX listing | Demonstrated (reported) | 12 Jun 2026 SPCX Nasdaq IPO, $135, ~$75B, ~$1.77T (CNBC etc.; ★ corrects Part 0’s private frame) |
| Starlink cash engine | Demonstrated (reported, conflict flagged) | Revenue ~$10–11.4B (~2/3 of total), ~8M subs, op income ~$4.4B (S-1 reporting / Trefis, source conflict) |
| Broad durable multi-player economy (b) | Unsupported | Independent downstream lacks durable profit / continuous service (Planet deferred, AST pre-commercial, LUNR partial failure) |
| Bubble/shakeout (c) | Early-to-middling (co-present) | Terran Orbital delisted, Virgin Orbit bankrupt, Astra ~98% down, Redwire/Momentus >20% drop, Jun-2026 rotation |
| Rocket Lab listed launch challenge | Demonstrated (scale gap) | Revenue $601.8M (+38%), Electron 100%; Neutron slipped (SEC 10-K) |
| “$1T space economy” projection | Flag (inter-bank divergence) | MS/Citi $1T by 2040 vs BofA $1T by 2030 / $3T by 2040; McKinsey $1.8T-by-2035 internally inconsistent (backbone core ~$775B); methodology differs (SpaceNews) |
| Where value is captured | Demonstrated (institutional) | Space Foundation: satellite services $108B, ground equipment $155B, far above launch (2024 $613B) |
5. Commercialization and competitive context (skeptic gate)
- Verified-clean. Listed-company financial facts (RKLB, PL, ASTS, LUNR revenue, income, backlog, mission results) are from each SEC filing; space-economy size (Space Foundation) and the SPAC shakeout (Terran Orbital acquisition/delisting) from institutional and trade-press sources — that filing/aggregate portion is clean.
- Proceed-with-caveats. (1) Marketed $/kg is not internal cost is not launch-business profit — the launch-cost collapse is a price, not SpaceX’s internal cost or launch-segment profit (Part 1). (2) Announced is not deployed is not operational is not profitable — Amazon Leo (Kuiper) deployment delay, AST pre-commercial, LUNR mission tip-over, Starship full-reuse unproven. (3) IPO valuation is not an earnings multiple — SpaceX’s ~$1.77T is a price on future growth; group GAAP results and Starlink-segment unit economics are partly undisclosed. (4) Source conflict is a flag — Starlink revenue $10B (Trefis) vs $11.4B (S-1 reporting) cannot be resolved to one figure. (5) Bank projections diverge internally — “$1T” splits 2030 (BofA) vs 2040 (MS/Citi) and $1T vs $3T; McKinsey’s $1.8T-by-2035 is internally inconsistent (backbone core ~$775B, the rest “reach” apps merely using GPS). (6) Co-movement is not a fundamentals verdict — the June-2026 space-stock rotation is a capital-flow signal, not a judgment on any individual company.
- No hold. All listed-company (RKLB, PL, ASTS, LUNR, Redwire, Momentus) and newly-listed SpaceX (SPCX) statements are factual, neutral and attributed; pre / low-revenue pure-plays are price-sensitive to launch, debut and IPO-rotation news.
Cross-domain hooks. Two neighboring axes connect. Quantum-sensing (PNT): space is the supply source of GNSS (GPS/Galileo/BeiDou) PNT signals, and the greater the jamming/spoofing/Kessler vulnerability of satellite PNT, the stronger the commercial logic for quantum inertial navigation (atom-interferometry gravimetry, quantum inertial sensors — the firm’s quantum-sensing series) as a GPS-denied backup; even where satellite downstream value capture is thin, PNT is an essential good, so quantum-sensing absorbs that “vulnerability premium.” Computing-power (data-center demand): the downlink data flood from megaconstellations and very-high-resolution EO translates into ground-station compute, AI analysis and data-center power demand, isomorphic to the computing-power series’ “power and data are the real bottleneck,” with space as the upstream data source.
6. The skeptic’s bottom line
- Announced is not durable. The strongest correction evidence is the SPAC-era shakeout — Terran Orbital delisted, Virgin Orbit bankrupt, Astra ~98% down — the extreme of “announced is not a durable business.”
- The central question resolves ambiguously. (a) single vertically-integrated capture (Starlink) is supported; (b) a broad multi-player durable economy is unsupported; (c) shakeout is co-present. It is “one wins, the rest correct,” not a clean single answer.
- Source conflict and projection divergence are flags, not facts. Starlink revenue conflicts across sources; the “$1T” projection diverges bank to bank; McKinsey’s $1.8T-by-2035 is internally inconsistent (backbone core only ~$775B, the rest “reach” apps merely using GPS) — refuted, analogous to prior-series market-size catches.
- Valuation is not earnings. The ~$1.77T is a price on future expectations; group GAAP results and Starlink-segment unit economics await post-IPO audited filings.
- Neutral-framing note. Included to prevent misreading listed-company (RKLB, PL, ASTS, LUNR, RDW, SPCX) implications as security signals.
7. Series wrap-up (Parts 0–5) and the firm through-line
The space-economy series traced the firm’s thesis — the launch-cost ($/kg) collapse headline vs the sustainable-unit-economics and effective-demand bottleneck — from the landscape (Part 0) through launch economics (Part 1), LEO megaconstellations (Part 2), applications and downstream value capture (Part 3), the bottleneck layer (unit economics, debris, spectrum, demand — Part 4), and commercial synthesis (Part 5). Three through-line conclusions:
- The real bottleneck is at the outcome layer — sustainable unit economics and downstream effective demand, not $/kg. Launch cost has already collapsed (Falcon 9 ~90%), but that collapse did not translate into a large multi-player economy; the only demonstrated large-scale deployment and cash flow is SpaceX/Starlink, one vertically-integrated player. The headline $/kg is only an entry point; the contest was decided at “who captures durable profit and demand downstream.”
- The collapse translated into a single winner plus a thin or correcting remainder (hypothesis a, with c co-present) — only Starlink at large-scale cash flow, other names down in the June-2026 IPO rotation, SPAC-era names shaken out. The “announced is not deployed is not operational is not profitable” gap is observed at every layer. (b) a broad multi-player durable economy is unsupported this cycle.
- Value is captured downstream and on the ground, but not distributed across many independent players — Space Foundation: satellite services $108B, ground equipment $155B, far above launch. “Launch got cheaper” is not “the space economy grew / many players prospered”; the winner-plus-government-anchor captures the downstream first, and independent pure-plays are left thin on profit and demand.
Position within the firm through-line. The space economy is the aerospace instance of the firm’s through-line, “the real bottleneck is at the outcome layer.” Isomorphic to GLP-1 (mechanism headline vs hard outcomes), energy-storage (lab Wh/L vs GWh $/kWh), computing-power (chip performance vs power and data centers) and attr-cm (modality ranking vs the background-therapy threshold), in space the bottleneck is $/kg vs sustainable unit economics and downstream effective demand. Cross-domain, it neighbors quantum-sensing (space supplies GNSS PNT; rising satellite-PNT vulnerability strengthens the GPS-denied quantum inertial-navigation commercial case — quantum absorbs the vulnerability premium), computing-power (the downlink data flood becomes ground-station compute and data-center power demand, with space as the upstream data source), and energy (launch cadence and orbital solar arrays neighbor ground data-center power and the LDES/SMR firming contest). This resolution (§3: current data best fits (a) single vertically-integrated capture, with (c) co-present) is the value to feed into the knowledge-index and convergence-ledger as: “launch $/kg headline collapse vs sustainable-unit-economics and downstream effective-demand bottleneck — confirmed in the space domain; the outcome-layer winner is a single vertically-integrated player.”
References
- CNBC. 2026. “SpaceX IPO — stock price, roadshow, Musk.” (SPCX Nasdaq IPO terms.) https://www.cnbc.com/2026/06/03/spacex-ipo-stock-price-roadshow-musk.html
- Forbes / Great Speculations (Trefis). 2025. “SpaceX Valuation Soars.” (Valuation ladder; Starlink revenue and subscriber estimates.) https://www.forbes.com/sites/greatspeculations/2025/12/16/spacex-valuation-soars/
- Morgan Stanley. “Global Space Economy.” (~$350B → $1T+ by 2040 projection.) https://www.morganstanley.com/Themes/global-space-economy
- SpaceNews. “The trillion-dollar question.” (Methodology/definition divergence in space-economy projections.) https://spacenews.com/the-trillion-dollar-question/
- CNBC. 2022. “Space industry is on its way to $1 trillion in revenue by 2040, Citi says.” https://www.cnbc.com/2022/05/21/space-industry-is-on-its-way-to-1-trillion-in-revenue-by-2040-citi.html
- Sahm Capital. 2026. “Space stocks in June gloom: Rocket Lab, Redwire, Firefly fade while SpaceX steals the show.” (Jun-2026 rotation.) https://www.sahmcapital.com/news/content/space-stocks-in-june-gloom-rocket-lab-redwire-firefly-fade-while-spacex-steals-the-show-2026-06-25
- Aviation Week. “Shooting stars: more startup space SPACs fizzle out.” (Terran Orbital, Virgin Orbit, Astra, Momentus cautionary set.) https://aviationweek.com/space/commercial-space/shooting-stars-more-startup-space-spacs-fizzle-out
- Space Foundation. 2025. The Space Report 2025 Q2. (2024 space economy $613B; satellite services $108B; ground equipment $155B.) https://www.spacefoundation.org/2025/07/22/the-space-report-2025-q2/
- Rocket Lab USA. 2025. Form 10-K (FY2025). SEC EDGAR. (Revenue $601.8M; Electron; Neutron; backlog.) https://www.sec.gov/Archives/edgar/data/1819994/000181999426000013/rklb-20251231.htm
Disclosure
This post is for information only and is not investment advice.
COI note: this post describes listed and private space companies — SpaceX (SPCX), Rocket Lab (RKLB), Planet Labs (PL), AST SpaceMobile (ASTS), Intuitive Machines (LUNR), Redwire (RDW), Terran Orbital (formerly LLAP, acquired by Lockheed Martin and delisted), Virgin Orbit (bankrupt), Virgin Galactic (SPCE), Momentus (MNTS), Astra, Amazon Leo (Kuiper), Blue Origin — in a descriptive, neutral context. Every revenue, valuation and market-size figure is attributed to the filing, announcement or trade-press aggregate it comes from; company claims, agency data, analyst estimates and press reports are separated, and many valuations and market-size figures are unverified (source-conflicting or projection-based), labeled as such. Marketed $/kg is not internal cost; announced is not deployed is not profitable. Quantitative claims are attributed to the vendor, filing or press report. Competitive statements are factual, neutral descriptions and are not buy/sell implications for any security. The author holds no position in, and has no financial interest in, the companies named.


Leave a comment