A Nature Energy Study Simulates Hypothetical 2026-2030 Heatwaves on Eight Western European Grid Models and Reports Load Shedding in Spain; It Is a Model Scenario Analysis, Not an Observation or a Forecast
Analysis based on information available as of 2026-11-03.
30-second summary
- What: This is a simulation (model scenarios built from public data), not an observation. Liang, Chen and Keshav report in Nature Energy (online 22 October 2026) that when line thermal limits are coupled to an AC optimal power flow model of eight Western European national grids, hypothetical 2026-2030 heatwaves produce bottlenecks and load shedding in Spain, while Germany and the UK show no substantial load shedding. In the represented French grid, average load shedding reaches 0.45% (authors’ modelled result).
- So what: The numbers are scenario-based vulnerability indicators for the grid configurations the authors could represent, not blackout predictions and not validated against measured conductor temperatures or real events. At some localized hotspots the modelled weather-dependent line capacity falls to nearly 50% of nominal rating. The authors cite AI infrastructure as one motivation for their 1-3% per year demand-growth cases, but they did not model data-center load separately.
- Now what: This is a planning-methodology paper at roughly TRL 3 by our assessment, with no commercial product attached. Watch for validation against operator data and dynamic line rating (DLR) measurements.
5-minute read
Why line limits matter in a heatwave
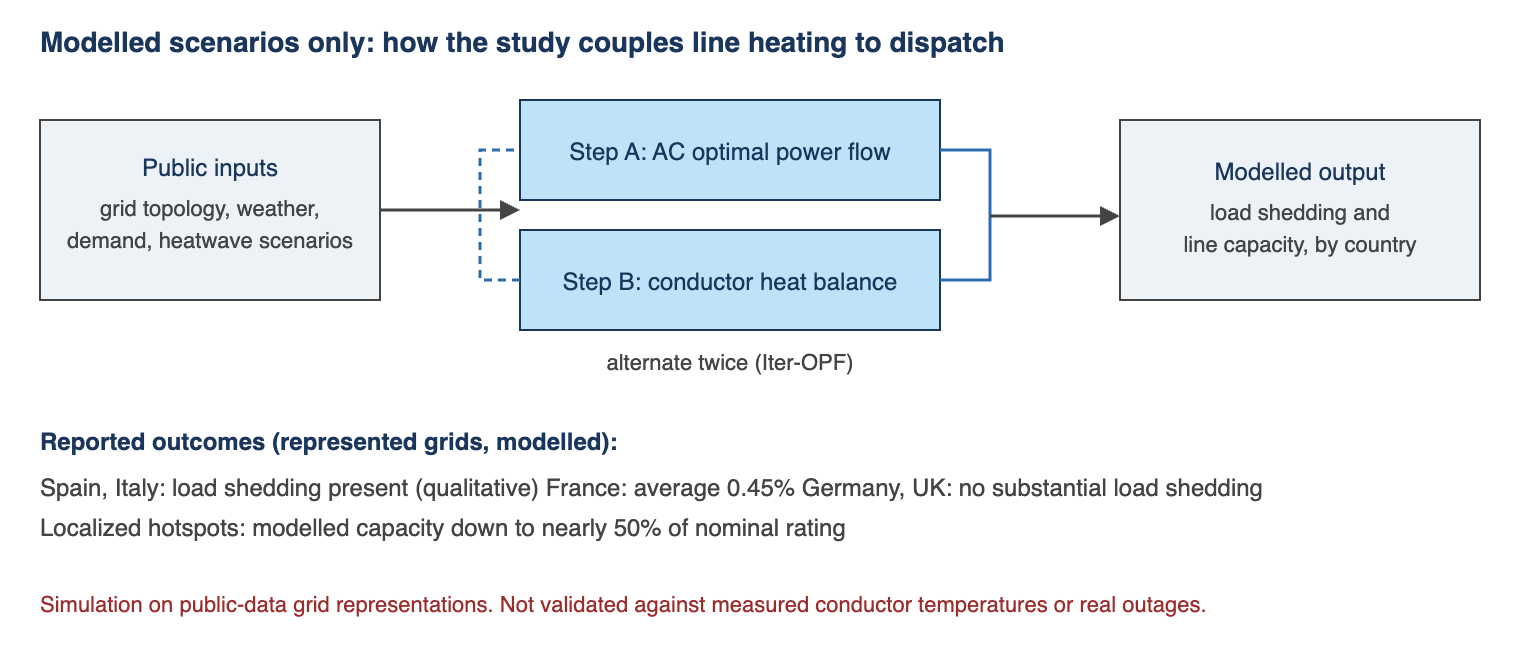
A hot day does three things at once: demand for cooling rises, thermal power plants can deliver less, and overhead lines shed heat less effectively, so the current they can carry safely falls. Standard AC optimal power flow (AC-OPF) planning tools mostly treat line capacity as a fixed number. The authors argue that this overstates what the network can move in a heatwave, and they build an “Iter-OPF” method that alternates between an AC-OPF and a conductor heat-balance calculation to bring the thermal limit into the dispatch problem at lower computational cost.
What the study reports
The authors simulate 480 hours of hypothetical heatwave per country, built by morphing the 2019, 2022 and 2024 heatwaves into 2026-2030 climate conditions, on eight national grid representations built from public data. In their results the Spanish grid shows bottlenecks and load shedding, Italy also shows load shedding, France averages 0.45%, and Germany and the UK show no substantial load shedding. Higher assumed demand growth increases modelled load shedding. The authors say the findings should be read as “near-term scenario-based vulnerability indicators” and not as long-term forecasts for individual countries.
How to read it
The ranking (Spain vulnerable, Germany robust) holds for the grid configurations the authors could represent, with no future reinforcement and with climate, demand and topology assumptions built in. Germany showing little load shedding in a public-data model is not a statement that the German grid is safe. The work is a methodology contribution with useful open code, not an operational tool or a field demonstration.
Deep dive
1. Background
Transmission planning has long relied on static line ratings and, in many studies, on simplified power-flow models. Overhead lines are limited by conductor temperature: current heats the conductor, and air temperature, wind and sun determine how fast heat is removed. In a heatwave, the same line can carry less current just when cooling load is high. The authors describe the effect of rising temperature on transmission capacity as under-quantified. Their approach is to combine temperature-dependent demand, generator derating and spatially resolved line thermal limits within an AC optimal power flow, a more physically complete formulation than the linearized DC approximation.
The authors are affiliated with City University of Hong Kong (two authors, one also listed with the Chinese University of Hong Kong, Shenzhen) and the University of Cambridge. The article was received in October 2024 and accepted in September 2026, and is open access under CC BY 4.0.
2. What this study newly establishes
Method. The proposed Iter-OPF alternates between the AC-OPF and a segment-level heat-balance calculation based on an IEEE 738-type conductor model, twice per case. The reference solution is a thermal-dependent OPF iterated to convergence (TD-OPF). Comparators include a quadratic-approximation variant and an OPF with a fixed 70% security margin. The authors report that the Iter-OPF differs from the converged solution by less than 1% on average, and that the converged approach costs more than four times the plain AC-OPF in computation while Iter-OPF costs about twice. Those are the authors’ computational claims; we did not rerun the code.
Inputs. Grid topology comes from the open PyPSA-Eur dataset, clustered to 75% of the original 380-kV resolution. Historical weather comes from ERA5 reanalysis and future climate from bias-corrected CORDEX data under the RCP4.5 pathway, with Copernicus energy datasets; historical demand comes from ENTSO-E. The conductor is a four-bundle ACSR type with a 90 C limit. The base case assumes 1% per year demand growth, with sensitivity up to 3%. The initial battery state of charge is 80% in the base case.
Results. The text reports: average load shedding of 0.45% in the represented French grid (Fig. 5b); modelled weather-dependent capacity falling to nearly 50% of nominal ratings at some localized hotspots under the represented scenarios (Fig. 3a); load shedding in Spain and Italy; and no substantial load shedding in Germany and the UK. For Spain the article describes a case of 442 internal AC lines compared over 480 hours. We do not give Spanish or Italian load-shedding percentages because they are not stated in the article text we read; they appear only in figure panels. Raising the initial storage state of charge reduces load shedding with diminishing returns. Interconnection gives Spain little relief, while France sheds less with links to Spain, Italy and the UK, according to the authors. Fixed 70% margins partly prevent overheating.
The AI-infrastructure link, stated precisely. In the demand-growth sensitivity, the authors write that annual load growth of 1-3% reflects emerging demands from AI infrastructure, electrified heating and cooling, and electric vehicles. So the authors name AI infrastructure as one motivation for the growth range. They do not, in the text we read, model AI or data-center load as a separate item or as geographically concentrated load, and the article text does not mention data centers. What the model shows is that a higher uniform growth rate produces more load shedding. How a concentrated new load sitting behind a thermally limited corridor would change the picture is outside what the paper tests; that question is our own extension and is not a finding of the study.
3. Strengths and limitations
Strengths.
- It couples a physical line-heating model to AC power flow at spatial resolution, including a case where one line crosses several weather zones (a 130 km line across eight, according to the authors).
- Inputs are public (PyPSA-Eur, ERA5, CORDEX, ENTSO-E), and the authors point to open code and source data, so independent reproduction is feasible in principle.
- The authors state limitations openly, including that the work cannot precisely forecast when or where blackouts will occur.
Limitations and open points.
- Model, not measurement. The 2019, 2022 and 2024 heatwaves are used to construct scenarios. In the text we read, model outputs are not compared with measured conductor temperatures, operator rating data or actual outage events. Validation covers numerical consistency of Iter-OPF against the converged solution and a small IEEE benchmark.
- Representation-dependent ranking. The abstract frames results as holding across the represented grid configurations. Clustering, missing recent reinforcements and the absence of operator-specific topology can inflate or hide bottlenecks, as the authors acknowledge.
- Scope. No future transmission, generation or storage build-out is included; storage is tested only by energy amount, not location or power rating; demand response is uncertain.
- Climate uncertainty transfers. A single RCP4.5-based dataset family drives the scenarios, so its uncertainty passes straight into the results. Statistics are descriptive; no inferential tests are reported.
- What we read. We read the open-access article text, as delivered through a summarization tool for most of its length, the abstract and the competing-interests and funding statements. We did not read the Supplementary Information, the peer review file or the figure panels, and we did not run the published code.
4. Connections to neighboring domains
Materials. The physical bottleneck is conductor temperature, with a 90 C limit on the modelled ACSR line. High-temperature low-sag conductors and dynamic line rating, which uses sensors or weather data to set limits in real time, address the same constraint. The paper did not test either; this connection is our own and its cost-benefit is unverified.
Climate data. The study is a case of climate-downscaled inputs driving an engineering model. Results are only as good as the climate pathway and the bias correction, and this is where cross-checks with other scenario sets would be most informative.
AI and compute. Data-center growth is a plausible driver of faster demand growth in some regions, and the authors mention AI infrastructure when motivating their growth range. But the paper models uniform growth, not siting. Reading it as showing that AI load causes European heatwave outages would go beyond the evidence; what it shows is that higher assumed growth increases modelled load shedding.
5. Commercialization and investment perspective
TRL 3 (our assessment). This is an analytical proof of concept for planning methodology. We saw no integration into operator tools and no field deployment. Regulatory and permitting paths are not applicable to the method itself. A commercialization timeline is not stated in the paper and we could not confirm one.
Parties. The article names no commercial vendor as a partner. Data sources are open (ENTSO-E, Copernicus, PyPSA-Eur). We identify no listed company directly tied to the work and draw no investment inference. Any link to grid-equipment, conductor or sensing suppliers would be our extrapolation and is not supported by the paper.
6. Counterarguments
- Simulation versus reality. The central caveat is that these are scenarios on public-data grid models. Without comparison to measured line temperatures or real events, the size of the effects, such as the 0.45% French average or the nearly 50% hotspot capacity, remains conditional on model assumptions.
- Conditional rankings. Spain being worse than Germany reflects the represented networks, not necessarily the real ones. Missing reinforcement could overstate Spanish bottlenecks, and clustering could hide German ones.
- Over-reading of the AI link. The authors’ mention of AI infrastructure motivates a uniform growth range. Extending this into a claim that AI demand drives heatwave blackouts in Europe would exceed what the study did.
- Operator options. Real operators can re-dispatch, curtail, use demand response or rate lines dynamically. The model includes only part of this toolbox, so modelled load shedding is not the same as expected outages.
- Not a forecast. The authors frame the results as near-term, scenario-based indicators rather than long-term forecasts of load shedding in individual countries.
- Novelty. We rate the novelty as moderate: a computationally efficient coupling of thermal limits with AC-OPF applied across eight grids. We have not independently established priority.
7. Indicators to watch
- Supplementary and figure-level results, including Spanish and Italian load-shedding values, which this post does not quote.
- Validation against measured conductor temperatures, dynamic line rating data or documented heatwave events.
- Re-runs with operator-grade topologies and planned reinforcements, and with other climate pathways beyond RCP4.5.
- Follow-up work modelling concentrated new loads, such as data centers, behind thermally limited corridors.
- Uptake of the open code by planners, and any trial of dynamic line rating or high-temperature conductors in the corridors the study flags.
References
- Liang, Enming, Minghua Chen, and Srinivasan Keshav. 2026. “Heatwave-induced capacity bottlenecks in European electricity grids.” Nature Energy. Published online 22 October 2026. DOI: 10.1038/s41560-026-02151-1. https://doi.org/10.1038/s41560-026-02151-1
- Author project page and code repository named in the article: emliang.github.io/Heat-Analysis and GitHub emliang/Heat-Analysis (contents not run by us).
- Input data sources named by the authors: PyPSA-Eur, ERA5, CORDEX (RCP4.5) with Copernicus energy datasets, and ENTSO-E. We read these only as described in the article.
Disclosure
- This article is for informational purposes only and is not investment advice.
- The author holds no position in any company named in this post.
- Conflict-of-interest notes:
- The three authors are affiliated with academic institutions (City University of Hong Kong, the Chinese University of Hong Kong, Shenzhen, and the University of Cambridge). The paper states: “The authors declare no competing interests.”
- Funding per the acknowledgements: Hong Kong Research Grants Council General Research Fund 11200223 and Collaborative Research Fund C1049-24G, a CUHK-Shenzhen start-up grant, and an endowed chair fund at Cambridge. The funder field in the bibliographic record was empty, so this list relies on our reading of the published acknowledgements.
- All quantitative results are the authors’ modelled results; we found no independent replication. The paper reports that anonymous reviewers were thanked and that a peer review file exists; we did not read it.
- Our reading was of the open-access article text (CC BY 4.0). The Supplementary Information, peer review file and figure panels were not read, and the published code was not run.
- The figure in this article is an original drawing; no figure from the source was reproduced.


Leave a Reply