When Do Protein Foundation Models Actually Help Experiments? A Budget-Matched Re-Analysis of ProteinGym (Preprint, Retrospective, Simulation)
Analysis based on information available as of 2026-11-03.
30-second summary
- What: A bioRxiv preprint (version 1, posted 2026-10-20, not peer reviewed) from authors at the University of Sydney, Columbia University Irving Medical Center, the Beijing Academy of Artificial Intelligence and Tsinghua University re-analyses existing ProteinGym data (217 assays, about 2.47 million variants, 95 precomputed zero-shot predictors). It compares strategies for finding top variants under the same measurement budget (20, 50 or 100 measurements). Every result is a retrospective recalculation on published measurements or a simulation that reveals stored values round by round. It is not a new wet-lab experiment or a prospective protein-engineering campaign.
- So what: In this benchmark, a predictor’s average ranking accuracy is only loosely tied to how well it finds the top 1% of variants. A calibrated foundation-model prior leads a simple additive model at small budgets, and that lead shrinks as more single-variant measurements become available. The result does not say that foundation models are unhelpful.
- Now what: Treat it as an evaluation framework, not a validated workflow. The link between accuracy and discovery rests on 20 predictor-level averages and is statistically imprecise (see the 5-minute read). Watch for released code, replication on other benchmarks and new proteins, and prospective laboratory rounds. TRL: not applicable (evaluation method).
5-minute read
What the authors did
Benchmarks for protein foundation models (FMs) usually rank predictors by a correlation between predicted and measured variant effects across a whole assay. A protein engineer, however, rarely cares about the whole distribution. The question is which few variants to make and test next. The preprint reframes the evaluation around that decision: given a fixed number of measurements, which strategy finds the best variants? Strategies include raw zero-shot scores, scores recalibrated per assay, a purely additive model built from measured single mutants, supervised regressors trained on the measurements, and acquisition policies that choose what to measure next. The main outcome is top-1% recall, meaning how many of an assay’s best 1% of variants appear in a list of 100 candidates.
What it reports
The abstract states that “Zero-shot accuracy explained less than one-fifth of the variation in discovery after calibration.” The supporting figure is a Pearson correlation of r = 0.44 between predictors’ average zero-shot accuracy and their average top-1% recall at 20 measurements. That correlation is computed across the averages of 20 predictors, not across variants. With only 20 points, the 95% confidence interval for r is roughly -0.003 to 0.74 and the two-sided p-value is about 0.052 (our arithmetic, not reported in the paper). The data therefore support “only loosely linked” or “no strong link demonstrated”, and they do not fix an upper bound of one-fifth.
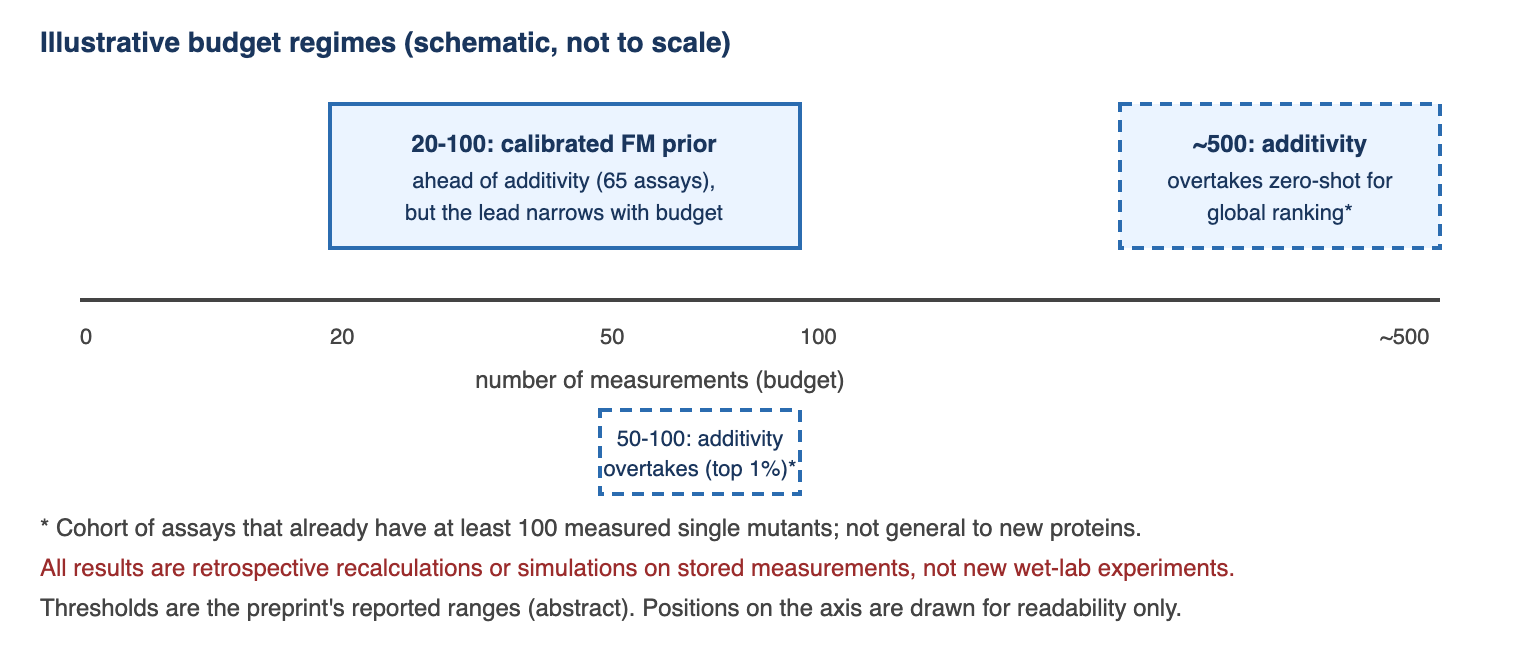
The other findings are more concrete. Per the abstract, a calibrated FM prior outperforms an additive model in the 20-100 measurement range, additivity overtakes zero-shot predictors for finding top variants at 50-100 measurements, and for global ranking only at about 500 measurements. The additivity crossover comes from a subset of assays that already have many measured single mutants, and a new protein with no measurements would not be in that position.
How far to take it
Because the active-learning experiments replay stored measurements, they omit assay noise, failed syntheses and batch effects. The preprint covers substitution variants only. The practical reading is modest: when comparing models for protein engineering, report outcomes at a stated measurement budget, and expect an FM prior to matter most when few measurements exist.
Deep dive
1. Background
Protein FMs, including protein language models and structure-informed predictors, are commonly judged on ProteinGym, a collection of deep mutational scanning and related assays in which a model predicts variant effects without task-specific training (zero-shot) and is scored by rank correlation. Spearman correlation across all variants in an assay measures how well a model orders the entire distribution. Directed evolution and protein engineering are tail problems: the aim is to find the few variants at the top of the distribution with a limited number of experiments. A model can be good at ordering the bulk and still be only modestly useful for picking the tail, and the reverse is possible too. The preprint takes this mismatch as its starting point and asks what experimental value an FM adds once a measurement budget is stated.
A second ingredient is the additive baseline. If single mutants have been measured, the effect of a multi-mutant variant can be approximated by summing its component effects. In ProteinGym, 72% of variants carry two or more substitutions (per the analysis of the preprint), so a baseline that only needs single-mutant measurements is a natural comparator, and it makes for a fairer contest than comparing an FM against nothing.
2. What this study newly establishes
Scope. The preprint uses 217 ProteinGym substitution assays with 2,465,767 variants and 95 precomputed zero-shot predictors. No new model is trained, and no wet-lab work is done. The strategies compared are raw zero-shot scores, per-assay calibrated priors (intercept and slope fitted to a few measurements), additivity from measured single mutants, supervised models (including ridge regression, Gaussian processes, gradient boosting, Kermut and ProteinNPT) and acquisition policies.
Findings from the abstract (confirmed against the preprint’s abstract). The counts above, and the budget thresholds: a calibrated FM prior leads an additive model at 20-100 measurements, additivity overtakes zero-shot predictors for top-variant discovery at 50-100 measurements and for global ranking at about 500.
Findings from the full text (extracted with a summarising tool; treat as the authors’ figures that we have not independently re-derived).
- Accuracy versus discovery. The best calibrated predictor, ProSST-2048, reaches a top-1% recall of 0.204 across 1,065 assay-splits drawn from 213 assays. The absolute level is low: even the best predictor recovers about a fifth of the top-1% variants in a 100-variant list. The accuracy-to-discovery link is r = 0.44 across 20 predictor averages. As noted above, the interval for that estimate (about -0.003 to 0.74) is wide, and the points may not be independent if some predictors belong to the same model family or appear in both raw and calibrated form; in that case the effective sample is smaller and the interval wider still. We could not check how the 20 scores were chosen.
- Prior versus additivity. In 65 assays with five random seeds, calibrated VenusREM and ProSST-2048 led a budget-matched additive model by Spearman margins of 0.321 and 0.317 at 20 measurements and 0.235 and 0.232 at 100. The lead shrinks but does not vanish. For top-1% recall, calibrated ProSST-2048 beat additivity in 582 of 1,065 splits (55%) at 20 measurements.
- Crossover. In a 31-assay cohort with at least 100 measured single mutants, additivity reaches mean Spearman values of 0.167, 0.277 and 0.419 at 20, 50 and 100 measurements. At 100 it exceeds GEMME (0.339) and ESM3 (0.403) but remains below ProSST-2048 (0.467). If every component single mutant is measured, additivity reaches 0.730 (66 assays) against 0.419 for ProSST-2048.
- Adding double mutants. Adding 20 double mutants to 20 single mutants raised held-out Spearman of a mutation-identity ridge model by 0.141 on average (268 runs; improvement in 94% of 65 assays).
- Prediction-guided acquisition. In a simulation on 27 assays (135 runs), six guided acquisition strategies found a top-1% variant in 72.6% to 77.8% of runs at 70 measurements, compared with 59.3% for random selection. Ensemble upper-confidence-bound selection was highest at 77.8%.
- Routing. A rule that assigns each assay to a prior-based or measurement-based strategy was evaluated on 198 assays. Top-1% recall rose from 0.168 to 0.188 and NDCG@100 from 0.673 to 0.683, with permutation P below 0.008 against random routing.
Taken together, the work supports a budget-dependent view: FM priors add the most when measurements are scarce, and the benefit diminishes as measured data accumulate. That is a plausible direction, and the preprint’s contribution is to quantify it on a common footing.
3. Strengths and limitations of the method
Strengths.
- The comparison includes non-FM baselines (additivity, MSA-based predictors such as GEMME) next to FMs, and matches budgets by counting the single-mutant measurements that additivity needs. That structure is fairer than comparing an FM with no baseline.
- The ground truth is measured data rather than synthetic responses, so the simulations do not depend on a model of the assay.
- The outcome (top-1% recall) is closer to engineering practice than a whole-distribution correlation, and the authors report multiple strategies at several budgets rather than a single leaderboard.
Limitations.
- Retrospective and simulated. Active learning is replayed on a pool of stored measurements. Real campaigns have assay noise, failed constructs, batch effects and costs that differ across variants.
- Statistical resolution of the central claim. The abstract’s statement that zero-shot accuracy explained less than one-fifth of the variation in discovery corresponds to r = 0.44 (r-squared about 0.19) over 20 predictor-level averages. Its 95% confidence interval runs from about -0.003 to 0.74 (r-squared from 0 to about 0.55), and p is about 0.052 (our calculation; the paper reports neither). “Loosely linked” is supported; a one-fifth ceiling is not.
- Metric asymmetry. Global Spearman measures the bulk of the distribution and top-1% recall measures the tail, so a modest correlation between them is partly expected. The contribution is to put that difference in a budget framework.
- Cohort selection. The additivity crossover comes from assays with at least 100 measured single mutants, in datasets where many variants are multi-mutants. That setting favours additivity and does not describe a new protein.
- Routing is in-sample. The routing threshold was estimated on the same assays used for evaluation. The stability check re-estimates the threshold leaving out one protein at a time (assignments unchanged in 216 of 217 cases), which tests the stability of the threshold, not out-of-sample performance. The gain is also small (recall +0.02).
- Scope. Substitutions in ProteinGym only. Insertions, deletions and de novo designs would need further controls, as the authors indicate. We could not confirm from the text we read which of the 95 predictors count as foundation models rather than alignment-based methods.
What we read. The full text is open access and has one version. We read roughly the first 100,000 of about 130,000 characters, plus the closing section, through a summarising tool, and checked the key numbers across three independent queries and against the abstract. The remaining part appeared to be references and site menus. We did not read the supplementary material or the figure data. We found no funding statement and no code or data availability statement in the full text; the Methods describe the work as a retrospective calculation on public data. The authors declare no competing interests.
4. Connections to neighboring domains
Closed-loop laboratories. The acquisition result (ensemble upper-confidence-bound selection finding a top-1% variant in 77.8% of simulated runs at 70 measurements, against 59.3% for random) has the same structure as the question a self-driving laboratory must answer: which experiment is worth running next, at what cost? It suggests that such systems should be evaluated against budget-matched baselines. Because the preprint is a replay on stored data, it is a template for the comparison, not evidence that closed-loop wet-lab rounds behave the same way.
Clinical language-model evaluation. Benchmarks that put the cost of requesting information on the same axis as accuracy, as in sequential diagnosis tests for large language models, share the idea of comparing strategies at equal cost. One difference is that here the correct answers are real measurements, whereas such clinical benchmarks may depend on synthetic responses.
Other biological foundation models. There is a recurring observation that benchmark metrics need not track the use case. Single-cell foundation models have been reported to lose to simple linear baselines on some perturbation tasks, which is the same family of concern. Whether a budget-matched design transfers to cell or genomic models is our hypothesis, not a result in this paper, and it would need a public dataset with enough ground-truth measurements.
5. Commercialization and investment perspective
TRL: not applicable. This is an evaluation methodology based on a retrospective recalculation of public data, with no product and no wet-lab component. A TRL scale does not describe it.
Commercial relevance. The practical interest lies with teams that run protein-engineering rounds and have to decide between buying more measurements and using a better prior. The preprint suggests, within its limits, that the prior matters most at the start and that measured single mutants become valuable as they accumulate. Whether this turns into a design tool for industry is speculation, and no evidence in the paper supports a timeline.
Companies. No listed company is tied to the work. The predictors evaluated come from a range of academic and commercial developers. We could not confirm from the text we read how the owners of individual models relate to the study, and we make no inference about any of them. One co-author is affiliated with the Beijing Academy of Artificial Intelligence; we could not determine whether any of the 95 evaluated predictors was developed there.
6. Counterarguments
- Do not read this as “foundation models do not help.” Calibrated priors led additivity over the full 20-100 measurement range in the 65-assay comparison. The value shrinks with budget, and it does not disappear.
- The headline statistic is imprecise. The abstract’s statement that zero-shot accuracy explained less than one-fifth of the variation in discovery comes from r = 0.44 across 20 predictor-level averages, with a 95% confidence interval of about -0.003 to 0.74 (our calculation). An upper bound of r = 0.74 cannot be excluded, so “only weakly linked” is better stated as “no strong link demonstrated”. If some of the 20 scores are closely related, the effective sample is smaller still.
- Simulation is not practice. The active-learning results replay stored values, so assay noise, failed syntheses and batch effects are absent.
- Cohort dependence. The additivity advantage appears where many single mutants are already measured. A new protein with no measurements, which is where an FM prior is most attractive, lies outside that cohort.
- Small, in-sample routing gain. The routing improvement is about 0.02 in recall, and its threshold was estimated on the same assays.
- Single benchmark, single preprint. The evidence comes from one dataset collection and one unreviewed manuscript with no independent replication. We found no code or data statement in the full text, so reproduction of the strategy comparisons depends on what the authors release.
- Our reading is partial. The numbers come from a summarising tool applied to most of the full text, and the key ones were checked against the abstract. The supplementary material was not read.
7. Indicators to watch
- Release of code and analysis data, and whether an independent group reproduces the budget-matched comparisons.
- Peer-reviewed version: whether the 20-predictor analysis is reported with confidence intervals, and whether the correlation holds with a larger or de-duplicated set of predictors.
- Replication on other benchmarks and on new proteins with no prior measurements, including insertions, deletions and designed sequences.
- A held-out evaluation of the routing rule on assays not used to set the threshold.
- Prospective wet-lab rounds that compare a calibrated prior, an additive model and acquisition policies at matched measurement budgets.
- Adoption of budget-matched reporting in other biological foundation-model benchmarks.
References
- Ding, Wenze, Chenlin Lu, Yao Li, Haipeng Gong, and Zhiyong Wang. 2026. “Decision benchmarking reveals when protein foundation models add experimental value.” Preprint, bioRxiv, version 1, posted 20 October 2026 (not peer reviewed). DOI: 10.64898/2026.10.13.758966. https://doi.org/10.64898/2026.10.13.758966. Only one primary study is cited here; the other works named in Section 4 (ProteinGym, sequential-diagnosis language-model benchmarks, single-cell foundation-model comparisons) are mentioned as context and their bibliographic details were not verified, so they are not itemised.
Disclosure
- This article is for informational purposes only and is not investment advice.
- The author holds no position in any company named in this post.
- Authors and affiliations (from Crossref and the bioRxiv record): Wenze Ding (University of Sydney), Chenlin Lu (Columbia University Irving Medical Center), Yao Li (Beijing Academy of Artificial Intelligence), Haipeng Gong (Tsinghua University) and Zhiyong Wang (University of Sydney; corresponding author).
- Competing interests: the preprint states that the authors declare no competing interests. We did not find a funding statement or a code and data availability statement in the full text.
- Quantitative claims are the preprint authors’ claims; the confidence interval and p-value for r = 0.44 are our own arithmetic from the reported r and n = 20. There is no independent replication.
- The preprint is a single version and is not peer reviewed. Detailed figures were extracted from about three quarters of the full text with a summarising tool and checked against the abstract; supplementary material was not read.
- The figure in this article is an original drawing; no figure from the source was reproduced.


Leave a Reply