Evidence-first notes on bioscience and deep tech, at the edge of the lab and the market. Information only — not investment advice.
The 30-second version
- What. AI compute demand doubles roughly every 5-6 months, and the binding constraint on scaling has shifted from silicon efficiency to physical grid capacity. A data center takes 2-3 years to build, but a grid interconnection takes 4-10 years (interconnection queues have backed up past 2,000+ GW).
- So what. Over 2028-2030, the workhorses that actually fill AI’s electricity demand are not new reactors, but (a) redistribution PPAs from existing nuclear plants to hyperscalers, and (b) behind-the-meter gas turbines. New and SMR nuclear are all claimed to start in 2030-2035, and most are at the zero-power criticality, licensing, or construction stage — so their real contribution in this window appears to be effectively zero.
- Now what. The metrics to watch are the actual online dates of nuclear PPAs (TMI/Crane 2028), FERC’s follow-up rulings on co-location, and the backlog and lead times of the three gas-turbine makers.
[Verification caveat — surfaced in the headline] The evidence here is not peer review but institutional outlooks, policy, and trade press, and the source asset’s verification status is PARTIAL (cross-checked against institutional primary sources plus counterparty disclosures; per-claim adversarial verification incomplete). The electricity-demand figures are inherently scenarios (EPRI Low 45 to High 94 GW), and the deployment years for new nuclear are company claims that cannot be independently verified. This post is for information only and is not investment advice.
The five-minute read
The AI bottleneck sits next to the chip
The popular narrative fixates on “winning AI = securing GPUs and foundry capacity,” because GPU capex is visible. But frontier AI training compute doubles every 5-6 months, and that is achieved not by transistor scaling but by physically deploying larger chip clusters. The constraint has moved from “efficiency per chip” to “MW you can plug into the cluster.” A single hyperscale AI campus now demands hundreds of MW to 1 GW+ — a continuous load on the order of a mid-sized city.
The scale of demand is bounded, low and high, by three institutions’ numbers. LBNL (a US congressionally directed national-laboratory report) sees data-center electricity going from 176 TWh (2023, 4.4% of US) to 325-580 TWh in 2028 (6.7-12%). EPRI (US) puts peak load at 21-22 GW (2024) rising to 45/71/94 GW in 2030 (Low/Med/High). IEA (global) sees a doubling from 485 TWh (2025) to about 950 TWh in 2030, but attaches the sober caveat that “data centers are less than 10% of global electricity demand growth.” Reading these in balance requires noting that headlines usually cite the High scenario (a hype signal).
Why “4-10 years”?
A data-center building takes 2-3 years to build. But the grid connection takes far longer. On LBNL’s “Queued Up” basis, the median from interconnection request to commercial operation doubled from under 20 months in 2005 to 55 months in 2023, and projects completing in 2025 exceed 5 years. The queue holds more than 2,000 GW (exceeding total US installed capacity), but most of it never gets built and drops out. Add 10+ years to build high-voltage transmission lines. This time mismatch creates the binding constraint.
What actually fills 2028-2030
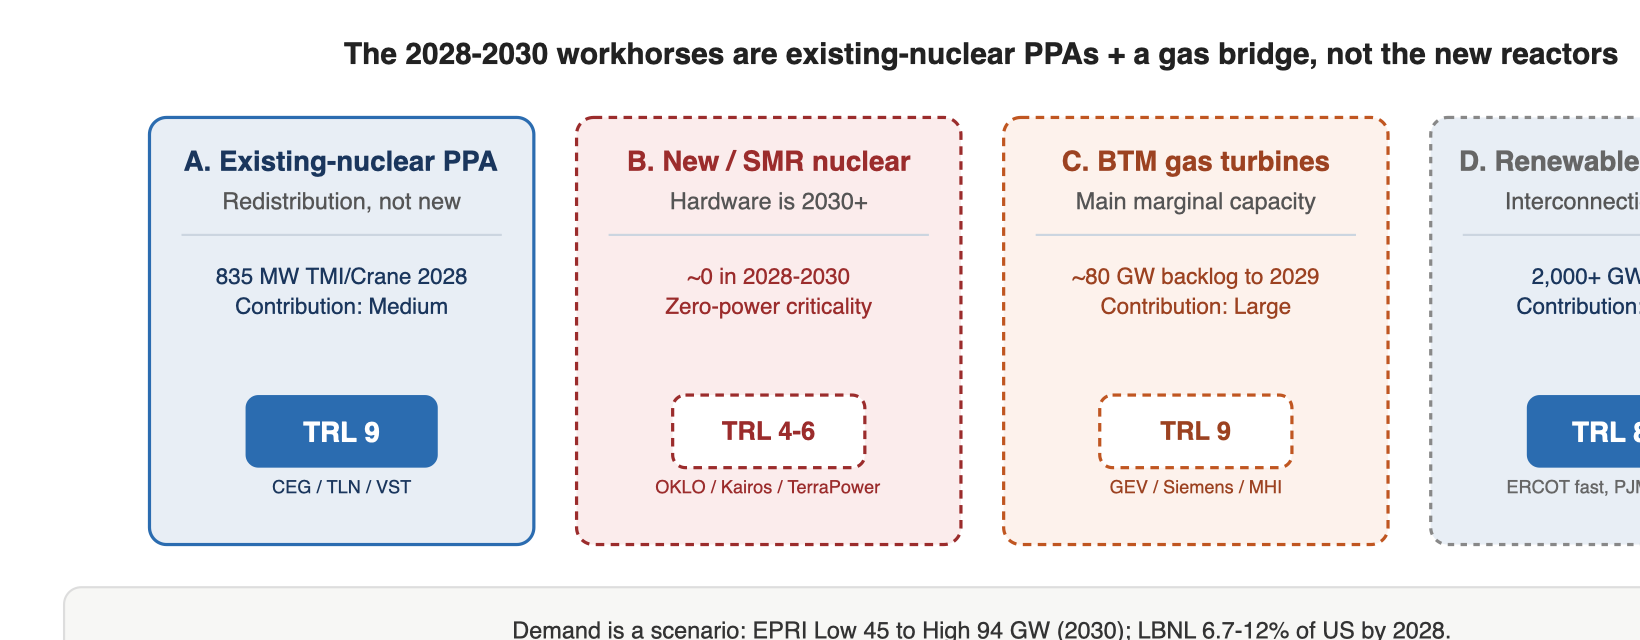
| Option | 2028-30 real contribution | Note | Representative firms / TRL |
|---|---|---|---|
| A. Existing-nuclear redistribution PPA | Medium | Not new electrons — redistribution | CEG / TLN / VST (listed) · TRL 9 |
| B. New / SMR nuclear | ~0 | Hardware is 2030+; many at zero-power | OKLO (listed) / Kairos / TerraPower · TRL 4-6 |
| C. Behind-the-meter gas turbines | Large | Main marginal new capacity; a bridge | GEV (listed) / Siemens / MHI · TRL 9 · 3-firm oligopoly, ~5-yr backlog |
| D. Renewables + storage | Medium | Regional variance; interconnection rate-limits | Many · TRL 8-9 |
Verdict: the workhorses that actually fill 2028-2030 are A (existing-nuclear redistribution) + C (a gas bridge). The B (new nuclear) that headlines emphasize contributes almost nothing in this window. Two qualifiers belong alongside this: A’s nuclear PPAs are mostly restarts or redistributions of existing/idle reactors, so they are not net additions to the grid, and C’s gas turbines are themselves becoming a new bottleneck through a three-firm oligopoly with a ~5-year backlog.
Deep dive
1. Background — the shifting axis of scaling
The through-line thesis of the computing-power series’ Part 0 was that “the bottleneck is somewhere else”: that the binding constraint on AI compute is not chips or capital, but grid access. Part 1 tests that thesis against the physical reality of procurement. Frontier AI training compute doubles every 5-6 months, driven not by silicon efficiency but by the physical deployment of larger clusters — so the constraint moves from “efficiency per chip” to “MW you can plug in.” [Part 0 / WEF, secondary/high]
2. What this investigation newly established — separating each procurement card’s real contribution
The core contribution is separating the actual 2028-30 contribution of the four cards that hyperscalers have played to bypass the “4-10 year grid.”
Option A — restart/redistribution PPAs from existing nuclear (contribution: medium, but not “new electrons”)
| Deal | Plant | Scale | Nature | Timeline | Listed |
|---|---|---|---|---|---|
| Microsoft-Constellation | TMI-1 → Crane Clean Energy Center | 835 MW | Restart of a plant closed in 2019 | 20-yr PPA, $1.6B, 2028 | CEG (NASDAQ) |
| Amazon-Talen | Susquehanna | 1.92 GW (initially 960 MW) | Redistribution of existing-reactor output | 17-yr PPA, 7-yr ramp, full by 2032, expires 2042 | TLN (NASDAQ) |
| Meta-Constellation | Clinton | 1,121 MW | Extension of an existing reactor whose subsidy is expiring | 20-yr PPA, starts 2027 | CEG |
What these share is that no new reactor is being built; existing (or recently operating) reactors are being locked up under long-term contracts. These are mature assets for which TRL discussion is moot — a restart is a regulatory and maintenance issue, not a technology demonstration. But because this adds no new electrons to the grid and instead assigns existing carbon-free power to a specific offtaker, there is a redistribution-vs-net-addition debate: the rest of the grid fills that gap with other (often fossil) generation.
Option B — new / SMR nuclear (contribution: near zero; hardware is 2030+)
Google-Kairos-TVA (Hermes 2, Gen IV fluoride-salt-cooled, up to 50 MW 24/7, claimed start 2030, whole deal 500 MW by 2035), Meta-Oklo/Vistra/TerraPower (up to 6.6 GW, by 2035), and — for reference — the W28-14 DOE pilot trio (100 kWt to 1 MWe, zero-power criticality 2026-06) all belong here. All claim starts after 2030, and many are still at zero-power criticality or the licensing/construction stage. This is not a demonstration of commercial power generation. New nuclear’s 2028-30 contribution to AI electricity is therefore effectively zero, and describing this window as being filled by new reactors is hype (analysis-standards §2 demo-gap).
Option C — behind-the-meter gas turbines (contribution: largest, the main marginal new capacity)
If US data-center demand reaches 325-580 TWh in 2028 (LBNL), that corresponds to 74-132 GW of generation capacity, much of which the industry expects to be met by medium/large and aeroderivative gas turbines. [NaturalGasIntel, trade/med] Gas turbines and reciprocating engines can supply continuous dispatchable baseload at data-center scale on short lead times, and placed behind-the-meter (self-generation) they bypass the interconnection queue (5+ years). Hyperscalers themselves frame this as a “temporary bridge fuel” to the grid — not a long-term solution, but a way to fill the 2028-30 gap. Yet the market is a three-firm oligopoly (GE Vernova NYSE: GEV, Siemens Energy, Mitsubishi Heavy Industries) carrying a ~5-year backlog. GE Vernova indicates a ~80 GW backlog at end-2025 (into 2029), an outlook of being sold out into 2030 by end-2026, a backlog-plus-reservations target of 110 GW, production capacity of 20 GW/yr (mid-2026) rising to 24 GW (mid-2028), and a ~3-year lead time on new orders. [Utility Dive/power-eng, trade/high]
Option D — renewables + storage (contribution: regional variance; interconnection is the rate-limiter)
Solar + BESS is attractive on lead time and capex, but runs into the same interconnection queue (2,000+ GW backed up, much of it renewables + storage). In markets where the queue and construction move quickly, like ERCOT, it is a real contributor; where congestion is high, like PJM, the constraint is large.
3. Strengths and limits of the methodology
The strength is overlaying primary sources of different character to bound the low and high ends — LBNL (a congressionally directed national laboratory), EPRI (an industry institution), IEA (global) — while contracts and rulings were cross-checked against the counterparties’ own disclosures and trade press. The limits are that (a) the material is outlooks, policy, and trade press rather than peer review, and (b) per-claim adversarial verification (three-vote) is incomplete. Electricity demand is inherently a scenario (a 2x gap between EPRI’s Low 45 and High 94 GW), and the commercial deployment years for new nuclear are company claims that cannot be independently verified. For these reasons the source asset keeps its verification status at PARTIAL.
4. Connections to neighboring domains
- Energy × AI-compute: compute doubling every 5-6 months → the constraint moves from silicon efficiency to grid MW. The time mismatch of data centers at 2-3 years vs. grid connection at 4-10 years is the binding constraint.
- Energy × Materials/Supply-chain: the 2028-30 marginal supply source, gas turbines, becomes a new bottleneck through a three-firm oligopoly with a ~5-year backlog. On the nuclear side there is the HALEU bottleneck (W28-14). The bottleneck cascades and relocates along “chips → power → generation-equipment supply chain.”
- Energy × Grid-AI (feedback loop): as candidates to ease the interconnection queue and transmission constraints, AI grid optimization, flexible interconnection, and demand response are rising. A structure in which compute partially unwinds the bottleneck compute created.
5. Commercialization and investment view (TRL, related firms)
| Option | TRL | 2028-30 real contribution | The real bottleneck | Representative firms |
|---|---|---|---|---|
| A. Existing-nuclear redistribution PPA | 9 (mature) | Medium | Regulation (FERC co-location) · redistribution debate | CEG · TLN · VST (listed) |
| B. New / SMR nuclear | 4-6 | ~0 (2030+) | Commercial generation unproven · HALEU | OKLO (listed) · Kairos · TerraPower (private) |
| C. BTM gas turbines | 9 | Large (main marginal source) | Turbine 3-firm backlog (~5 yr) · emissions · regulation | GEV (listed) · Siemens Energy · MHI |
| D. Renewables + storage | 8-9 | Medium (regional variance) | Interconnection queue · transmission | Many |
Company names and tickers are factual descriptions in a commercialization context and are not buy/sell implications. In particular, Option B’s “limited 2028-30 contribution” is a fact about timelines, not a ranking of securities (see the opposing view and the Disclosure below).
6. The opposing view (skeptic block)
The following quotes verbatim the mandatory caveats from the source asset’s skeptic gate.
- The workhorses filling 2028-30 AI electricity are not new reactors but existing-nuclear redistribution PPAs and behind-the-meter gas. New and SMR nuclear are all claimed to start in 2030-2035, and many are at zero-power criticality, licensing, or construction (inherited from W28-14) — real contribution in this window is effectively zero.
- The nuclear PPAs (TMI/Crane, Susquehanna, Clinton) are mostly restarts/redistributions of existing/idle reactors, not new construction. That this is a reassignment of carbon-free power to an offtaker — not a net grid addition — must be stated alongside, to prevent a “nuclear renaissance” misreading.
- The electricity-demand outlook is a scenario (EPRI Low 45 to High 94 GW, LBNL 6.7 to 12%). Headlines usually cite the High case, while the IEA, from a global vantage, attaches the caveat that data centers are less than 10% of 2030 electricity-demand growth.
- Behind-the-meter / co-location is not a regulatory free pass — on 2024-11-01 FERC rejected the Talen-Amazon co-location ISA amendment 2-1 (“failed to demonstrate necessity,” explicitly citing concern about precedent for similar interconnection customers). On the source’s reporting basis, the related equities fell at the time (Constellation -12.6%, Talen -8%), described here only as past fact. Gas turbines too are a new bottleneck through a three-firm oligopoly with a ~5-year backlog.
- For information only, not investment advice. This must not be read as a negative implication for pure-play nuclear listed equities (OKLO, SMR, NNE); “limited contribution” is a fact about the 2028-30 timeline, not a ranking of securities.
Also inheriting the Option B demo-gap: as confirmed in W28-14, the DOE pilot trio are all at zero-power criticality, and none has produced measurable generation output, capacity factor, or net-energy data. Criticality is not power generation.
7. Metrics to watch (falsifiable predictions)
The following inherits the source asset’s falsifiable predictions.
- [P1] The majority of the electricity for AI data centers newly coming online in 2028-2030 is supplied by gas plus the existing grid, not by nuclear. — Falsifier: weakened if, by 2030, new/SMR nuclear supplies a cumulative 1 GW+ of continuous (metered) generation to hyperscaler AI load.
- [P2] The start of continuous generation to hyperscalers from new reactors such as Kairos Hermes 2 slips past 2030. — Falsifier: refuted if Hermes 2 begins metered 50 MW 24/7 supply to the TVA grid within 2030.
- [P3] Gas-turbine lead times (currently ~3 years, with an outlook of being sold out into 2030) are reported as an explicit constraint on 2027-2028 new AI-data-center construction starts. — Falsifier: weakened if any of the three firms achieves a meaningful lead-time reduction (<2 years) by 2027. (GE Vernova itself has countered that “turbines are not gating the buildout,” so both sides’ claims are stated together.)
References
Chicago author-date style. Sources, tiers, and URLs inherited verbatim from the source asset.
Institutional primary (high)
- IEA. 2025. Energy and AI — Energy demand from AI. https://www.iea.org/reports/energy-and-ai/energy-demand-from-ai
- LBNL. 2024. 2024 United States Data Center Energy Usage Report (2024-12, congressionally directed under the Energy Act 2020). https://eta.lbl.gov/publications/2024-lbnl-data-center-energy-usage-report
- EPRI. 2026. Powering Intelligence 2026. https://powering-intelligence.epri.com/executive-summary.html
- LBNL. Queued Up (interconnection queues). https://emp.lbl.gov/queues
Institutional / analyst (med-high)
- RMI. 2025. “The Interconnection Queue Continues to Be a Barrier.” https://rmi.org/interconnection-reform-ai-data-centers-generator-queues/
- Ascend Analytics. “Can US Interconnection Queues Survive Data Center-Driven Load Growth?” https://www.ascendanalytics.com/blog/large-load-interconnection-queues-data-center-grid-access
Trade press / counterparty (high — contract and ruling facts)
- Utility Dive. 2024. “Constellation plans 2028 restart of Three Mile Island unit 1.” https://www.utilitydive.com/news/constellation-three-mile-island-nuclear-power-plant-microsoft-data-center-ppa/727652/
- Utility Dive. 2025. “Talen to sell Amazon 1.9 GW from Susquehanna.” https://www.utilitydive.com/news/talen-amazon-aws-susquehanna-nuclear-data-centert/750440/
- Utility Dive. 2024. “FERC rejects interconnection pact for Talen-Amazon” (2024-11-01, 2-1). https://www.utilitydive.com/news/ferc-interconnection-isa-talen-amazon-data-center-susquehanna-exelon/731841/
- Utility Dive. 2026. “Meta nuclear deal Oklo, Vistra, TerraPower.” https://www.utilitydive.com/news/meta-nuclear-deal-oklo-vistra-terrapower-ai-data-centers/809215/
- Kairos Power / Power-Eng. 2025. “Google, TVA, Kairos Gen IV PPA.” https://kairospower.com/external_updates/google-kairos-power-tva-collaborate-to-meet-americas-growing-energy-needs
- Utility Dive / power-eng. 2026. “GE Vernova 80-GW gas turbine backlog into 2029.” https://www.utilitydive.com/news/ge-vernova-gas-turbine-investor/807662/
Trade press (med — frame with caution)
- NaturalGasIntel. “On-Site Natural Gas Generation Gains Favor with Hyperscalers as Bridge to Grid.” https://naturalgasintel.com/news/on-site-natural-gas-generation-gains-favor-with-hyperscalers-as-bridge-to-grid/
Internal firm inheritance
- Part 0 landscape —
knowledge-base/deep-dives/computing-power/part0-landscape.md§3 - W28-14 DOE reactors —
outputs/analyses/2026-W28/energy-reactor-pilot-program.md
Disclosure
This post is for information only and is not investment advice.
- COI note: this post describes numerous listed companies (Constellation Energy CEG, Talen Energy TLN, Vistra VST, Oklo OKLO, NuScale SMR, GE Vernova GEV, Nano Nuclear NNE, and others) factually and neutrally in a commercialization context. Quantitative claims are attributed to their respective institutions, vendors, or counterparties (electricity demand = IEA/LBNL/EPRI outlooks; new-nuclear deployment years = company claims, independently unverifiable; gas-turbine backlog = GE Vernova / trade press). The equity moves around FERC’s 2024-11 Talen-Amazon ruling (CEG -12.6%, TLN -8%) are described only as past fact reported by the source, not as an investment implication.
- Verification status (inherited): PARTIAL — key figures were cross-checked against institutional primary sources plus counterparty disclosures, but the material is not peer review and per-claim adversarial verification (three-vote) is incomplete.


Leave a Reply