Analysis based on information available as of 2026-10-23.
30-second summary
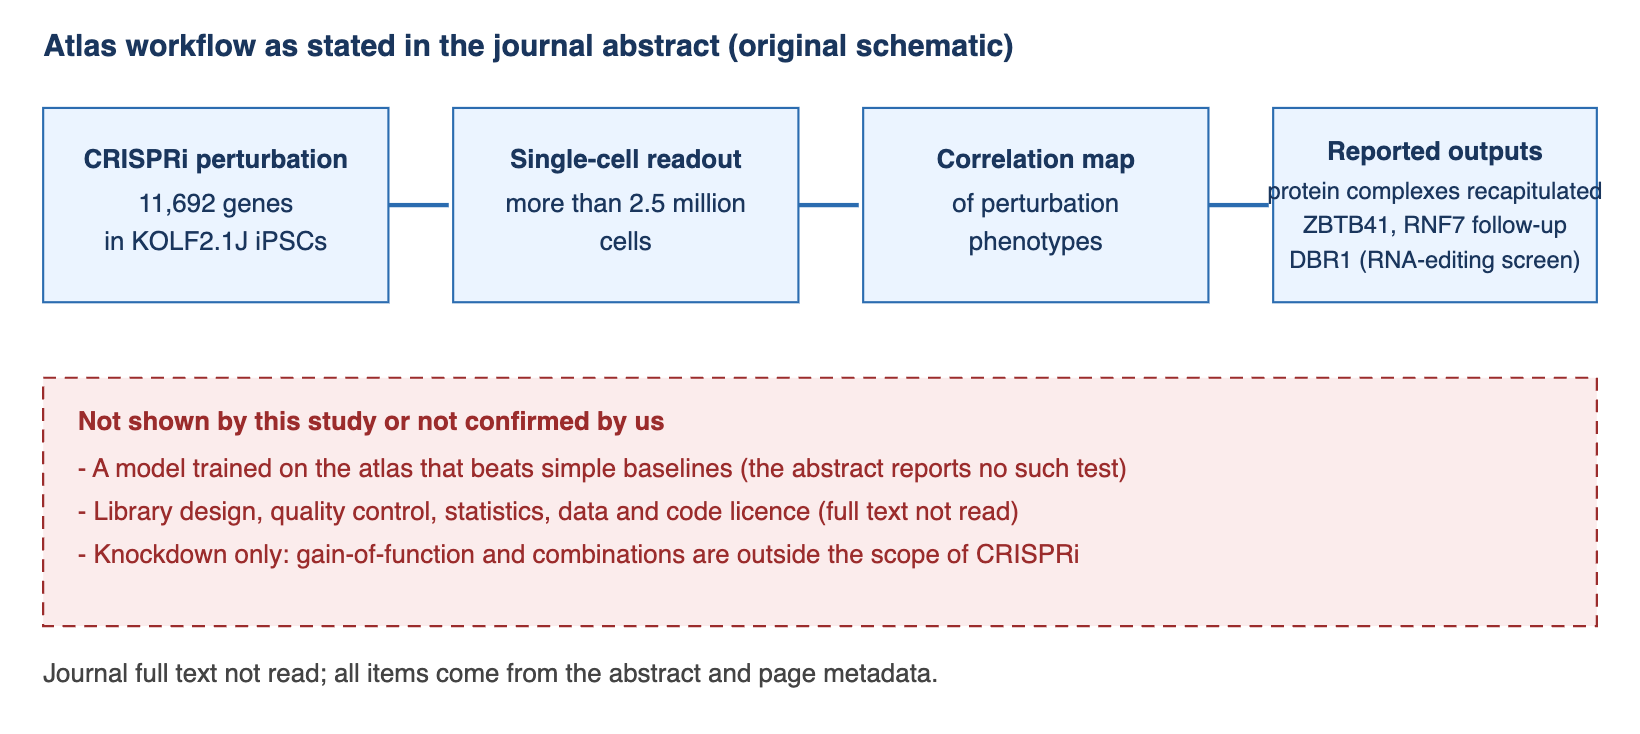
- What: Nourreddine, Doctor, Dailamy and colleagues (22 authors; corresponding author Prashant Mali) published in Nature Biotechnology (online July 2026) a CRISPR interference (CRISPRi) perturbation atlas in the human induced pluripotent stem cell (iPSC) line KOLF2.1J. The abstract reports transcriptional phenotypes for 11,692 perturbed genes across more than 2.5 million single cells, a correlation-based cell map of the pluripotent state that recapitulates functionally related protein complexes, follow-up of ZBTB41 (a metabolic factor) and RNF7 (a pluripotency regulator), and a genome-scale screen of A-to-I RNA-editing modulators in which DBR1 was validated as a potent regulator.
- So what: This is a data resource, not a model, and it tests no machine-learning system. It widens the data available for training and benchmarking “virtual cell” and cell foundation models (FMs), but a larger dataset does not by itself show that such models predict perturbation effects better than simple baselines. The link to virtual-cell models is our inference, not a claim of the abstract. We read the journal abstract and page metadata only; the full text is behind a paywall and was not read, so methods, statistics, data licence and screen design are unverified.
- Now what: We place the atlas as a resource at about TRL 4 and the virtual-cell applications it might feed at roughly TRL 2-3 (our assessment). The useful signal is whether models trained or benchmarked on this atlas beat linear baselines under leakage-controlled, prospective evaluation. Until then its value is best described as a better benchmark substrate.
5-minute read
What was built
Perturb-seq combines a genetic perturbation with single-cell RNA sequencing, so that each cell carries a record of what was altered and how its transcriptome responded. In this atlas the perturbation is CRISPRi, a method that lowers transcription of a targeted gene rather than cutting it. The cell line is KOLF2.1J, a human iPSC line. The abstract describes the product as an “expressed genome-scale” atlas: transcriptional phenotypes for 11,692 perturbed genes across more than 2.5 million single cells. Because CRISPRi acts on genes that are transcribed, “genome-scale” here refers to the genes expressed in these cells, not every gene in the genome.
What the abstract reports it found
The authors used correlations among perturbed phenotypes to build a cell map of the pluripotent state, which they describe as showing “rich recapitulation of functionally related protein complexes.” That supports the data’s internal validity, but it recovers structure already known and is not a prediction outside the data. They then followed up two genes: ZBTB41 as a metabolic factor and RNF7 as a pluripotency regulator, with metabolic tracing, immunofluorescence and protein-protein interaction assays. Lastly, they used the atlas to run a genome-scale screen of A-to-I RNA-editing modulators, read out by direct transcriptome-wide RNA editing, and report DBR1 as a potent regulator that was mechanistically validated. These are target hypotheses in a stem-cell system, not therapeutic results.
Why it matters for cell foundation models
This section is our inference; the abstract describes the work as a resource for interrogating pluripotency regulatory networks and does not mention foundation models. Perturbation-prediction models are data-limited, so a single-background, million-cell reference could be useful for training and for building benchmarks with fewer batch confounders. A 2025 paper in Nature Methods by Ahlmann-Eltze, Huber and Anders, titled “Deep-learning-based gene perturbation effect prediction does not yet outperform simple linear baselines,” frames the benchmark question that any such model faces. More data may also strengthen linear baselines, so scale alone does not settle the question.
Deep dive
1. Background
Pooled CRISPR screens with single-cell readouts (Perturb-seq) turned gene perturbation into a high-dimensional phenotype: instead of one number such as growth, each perturbation is described by a full expression profile. Human iPSCs are a distinct setting from cancer or immortalised lines: they are a starting point for differentiation and are used for disease modelling. Perturbing a large share of the expressed genes in one iPSC background gives a reference in which the genetic context is held constant.
In parallel, “virtual cell” projects aim to train models that predict how a cell responds to a perturbation it was not trained on. These efforts need large, clean perturbation data and benchmarks that reveal whether a model has learned anything beyond simple averages. This atlas sits on the data side of that effort.
2. What this study newly establishes
Resource (abstract). An expressed genome-scale CRISPRi perturbation atlas in KOLF2.1J iPSCs: 11,692 perturbed genes and more than 2.5 million single cells, accessible through a data portal (listed in the references). The data and code licence was not confirmed.
Method validity (abstract). Correlations among perturbed phenotypes yield a cell map in which functionally related protein complexes are recapitulated, which is the main internal check that the map reflects real biology.
New biology (abstract). ZBTB41 as a metabolic factor and RNF7 as a pluripotency regulator, supported by metabolic tracing, immunofluorescence and protein-protein interaction assays; and DBR1 as a potent regulator of A-to-I RNA editing from a genome-scale screen of editing modulators, which the authors report as mechanistically validated. We have not seen the screen design or the data behind these statements.
What it does not establish. It does not test any foundation model, and it does not show that a model trained on it outperforms simple baselines. Perturb-seq at scale is an established approach; what the abstract adds is the scale combined with the cell type, the follow-up of specific regulators and the editing screen. We grade it as an infrastructure increment.
Reading status. Our reading is limited to the journal abstract and the article page metadata (authors, affiliations, competing-interest statement). The journal full text is behind a paywall and was not read. We therefore do not describe library design, sequencing platform, quality control or statistics.
3. Strengths and limitations of the method
Strengths (from what the abstract states).
- A single genetic background and a named reference line reduce line-to-line variability, which helps benchmark design.
- Non-cancer, pluripotent cells broaden the cell contexts available for perturbation data.
- Recovery of functionally related complexes from the correlation map is a reasonable internal sanity check, and a subset of new findings was followed up with several assay types.
- A public data portal is stated, which makes reuse feasible.
Limitations.
- Dataset, not model. No predictive capability is claimed. Reading the atlas size as model capability would be a category error.
- Knockdown only. CRISPRi lowers transcription of expressed genes. Gain-of-function, non-expressed genes and combinatorial perturbations are outside its scope.
- In-distribution recovery. Recovering known complexes demonstrates structure within the data, not out-of-distribution prediction. Only ZBTB41, RNF7 and DBR1 are reported with follow-up assays.
- Single cell type. Findings in iPSCs may not transfer to differentiated or diseased cell types.
- Source tier. Only the abstract and page metadata were read; methods and statistics are unverified.
4. Connections to neighboring domains
Machine learning evaluation. The question for any model trained on this atlas is how train and test are split. Perturbed genes that belong to the same complex show correlated phenotypes, so placing such genes on both sides of a split can leak information. A credible test would hold out genes or pathways, run strong simple baselines (linear regression, PCA on highly variable genes, additive models) on the same split, and ideally validate predictions prospectively in the laboratory. This mirrors the benchmark-versus-real-world problem familiar from general machine-learning leaderboards.
AI-enabled drug discovery. Perturbation atlases sit at the upstream, data layer of a discovery stack. Newly reported regulators such as ZBTB41 and DBR1 are target hypotheses; the stages from hypothesis to efficacy evidence remain to be crossed. This is a structural analogy, not evidence of a pipeline result.
RNA editing. The DBR1 finding touches target discovery for A-to-I editing biology. We record only the abstract’s statement and make no quantitative claim.
Metabolic disease (weak link). ZBTB41 as a metabolic factor is conceptually adjacent to metabolic-disease target discovery, but the finding is in pluripotent-cell biology and the distance to a clinical target is large. We note it only as a loose association.
5. Commercialization and investment perspective
TRL. As an openly accessible research dataset the atlas is at about TRL 4 by our assessment. The virtual-cell applications it could support are at roughly TRL 2-3; dataset maturity should not be read as model maturity.
Commercial timeline and companies. The work is an academic resource, and the abstract describes no product. Several authors report company relationships in the competing-interest statement, reproduced in the Disclosure below. We found no statement in what we read that any of those companies uses this atlas, and we draw no investment inference.
6. Counterarguments
- Data scale versus capability. A bigger atlas does not guarantee that foundation models will outperform simple baselines. The 2025 Nature Methods benchmark by Ahlmann-Eltze and colleagues is titled as finding that deep-learning perturbation predictors do not yet outperform simple linear baselines; we cite it only for that title-level point. The authors of the atlas describe it as a resource for studying pluripotency regulatory networks.
- Recovery is not prediction. Reproducing known protein complexes is expected if the data are good, but it does not show that the map predicts unseen perturbations.
- Knockdown scope. Findings apply to the expressed genes of one cell line under partial gene repression. “Genome-scale” should be read with that restriction.
- Evidence tier. The key figures are the authors’ abstract-level claims; we did not read the full text, so licence terms, library design, statistics and the DBR1 screen design are unverified.
- Possible over-reading by others. Because virtual-cell narratives are popular, there is a risk that the atlas is cited as evidence of model capability. Nothing in the abstract supports that reading.
7. Indicators to watch
- The journal full text: CRISPRi library and quality-control details, statistics, data and code licence, and the DBR1 screen design.
- Published models trained or benchmarked on this atlas, reported against linear, PCA-based and additive baselines on identical, leakage-controlled splits.
- Prospective laboratory validation of predictions for perturbations or cell types outside the atlas.
- Public results from community virtual-cell challenges and independent benchmarks, and whether this atlas serves as a non-cancer test substrate.
- Independent replication of the ZBTB41, RNF7 and DBR1 findings, and extension of the approach to differentiated cell types.
References
- Nourreddine, S., Doctor, Y., Dailamy, A., et al. (22 authors). 2026. “A genome-scale CRISPRi perturbation atlas of human induced pluripotent stem cells.” Nature Biotechnology, online July 2026. DOI 10.1038/s41587-026-03199-w. https://www.nature.com/articles/s41587-026-03199-w (abstract and page metadata read; full text not read).
- Preprint version: “A Perturbation Cell Atlas of Human Induced Pluripotent Stem Cells.” bioRxiv. DOI 10.1101/2024.11.03.621734. https://doi.org/10.1101/2024.11.03.621734 (not relied on for any claim above).
- Ahlmann-Eltze, C., W. Huber, and S. Anders. 2025. “Deep-learning-based gene perturbation effect prediction does not yet outperform simple linear baselines.” Nature Methods. DOI 10.1038/s41592-025-02772-6. https://doi.org/10.1038/s41592-025-02772-6 (cited for its title only).
- Interactive atlas portal. https://y-doctor.github.io/KOLF2.1J_Perturbation_Cell_Atlas/ (licence not confirmed).
- Only the journal abstract and page metadata were available for the atlas itself, so this list is thinner than a full-text review would provide.
Disclosure
- This article is for informational purposes only and is not investment advice.
- The author holds no position in any company named in this post.
- Conflict-of-interest notes:
- Affiliations listed on the article page include the University of California San Diego (Department of Bioengineering and School of Medicine), the University of California San Francisco (Quantitative Biosciences Institute and others), the Gladstone Institutes, Stanford University, the Salk Institute for Biological Studies, KTH Royal Institute of Technology (SciLifeLab) and other institutions.
- Competing-interest statement of the paper, as published on the article page: P.M. is a scientific cofounder of Shape Therapeutics, Boundless Biosciences, Navega Therapeutics, Pi Bio and Engine Biosciences; the terms were reviewed and approved by the University of California, San Diego under its conflict-of-interest policies. T.I. is a cofounder, advisor and holder of equity for Data4Cure and Serinus Biosciences, and an advisor and shareholder for Ideaya BioSciences; the terms were reviewed and approved by the University of California, San Diego under its conflict-of-interest policies. The N.K. laboratory has received research support from Vir Biotechnology, F. Hoffmann-La Roche and Rezo Therapeutics; N.K. has a financially compensated consulting agreement with Maze Therapeutics, is president and on the board of directors of Rezo Therapeutics, and is a shareholder in Tenaya Therapeutics, Maze Therapeutics, Rezo Therapeutics, GEn1E Lifesciences and Interline Therapeutics. E.L. is a cofounder of GenBio.ai and an advisor for the Chan-Zuckerberg Initiative Foundation, Element Biosciences, Cartography Biosciences, Pfizer and Pixelgen Technologies. The remaining authors declare no competing interests.
- Funding information was not visible in the material we read and is unverified.
- Quantitative claims (number of genes, number of cells, follow-up of named regulators) are the authors’ claims as stated in the journal abstract; they were not independently reproduced.
- The interpretation that a dataset is not a model, and the bridge to virtual-cell and foundation models, are our own reading and are separate from the authors’ claims.
- Our reading was limited to the journal abstract and article page metadata; the full text was not read.
- The figure in this article is an original drawing; no figure from the source was reproduced.


Leave a Reply