Huntington’s Disease Cortical and Striatal Neurons Appear to Share a ~150-CAG Threshold: A Postmortem Cross-Sectional Model, Not a Treatment Test
Analysis based on information available as of 2026-11-03.
30-second summary
- What: A Cell paper (October 2026; McCarroll lab and co-authors, 13 authors) measured the length of the Huntington’s disease gene (HTT) CAG repeat and gene expression in the same nuclei from postmortem human cortex. Its abstract reports that toxicity begins at about 150 CAG repeats in both cortical and striatal neurons, and that somatic expansion rates differ by up to 20-fold between pyramidal neuron subtypes. This is a one-time observation of donated brain tissue plus a model inferred from it. It is not a test of any treatment, and no neuron was followed over time.
- So what: The authors argue that cortex and striatum degenerate through the same cell-autonomous process, reached at different speeds by different cell types, rather than mainly through cortex-to-striatum connectivity. That reading competes directly with a 2024 Neuron study that stressed corticostriatal projection neurons. Two things limit confidence: the 12-region analysis rests on a single donor, and the detailed numbers we cite come from the earlier preprint (v2), not from the published article, which we could not open.
- Now what: Read it as a mechanistic hypothesis at roughly TRL 2. If it holds, therapies aimed at slowing somatic expansion would need to be judged in cortical neurons too, not only in striatum. Watch for an independent replication, longitudinal or animal-model tests of the threshold, and the cell-type specificity of repair-gene targets.
5-minute read
The question
In Huntington’s disease (HD), an inherited CAG repeat in HTT lengthens further inside non-dividing neurons over a lifetime. Striatal neurons are hit first, and cortical neurons also degenerate. Is cortical loss a consequence of striatal damage and lost connections, or the same cell-intrinsic process running in its own cells?
What was done
Using a single-nucleus method the group developed for striatum, the authors read CAG length and RNA from the same nuclei. Eleven people with HD contributed 70,760 nuclei from two cortical areas (BA4 and BA32). One of them also supplied 56,889 nuclei from ten more areas. A separate cell-loss analysis used at least 50 HD and at least 50 control brains.
What they report, and what it does not show
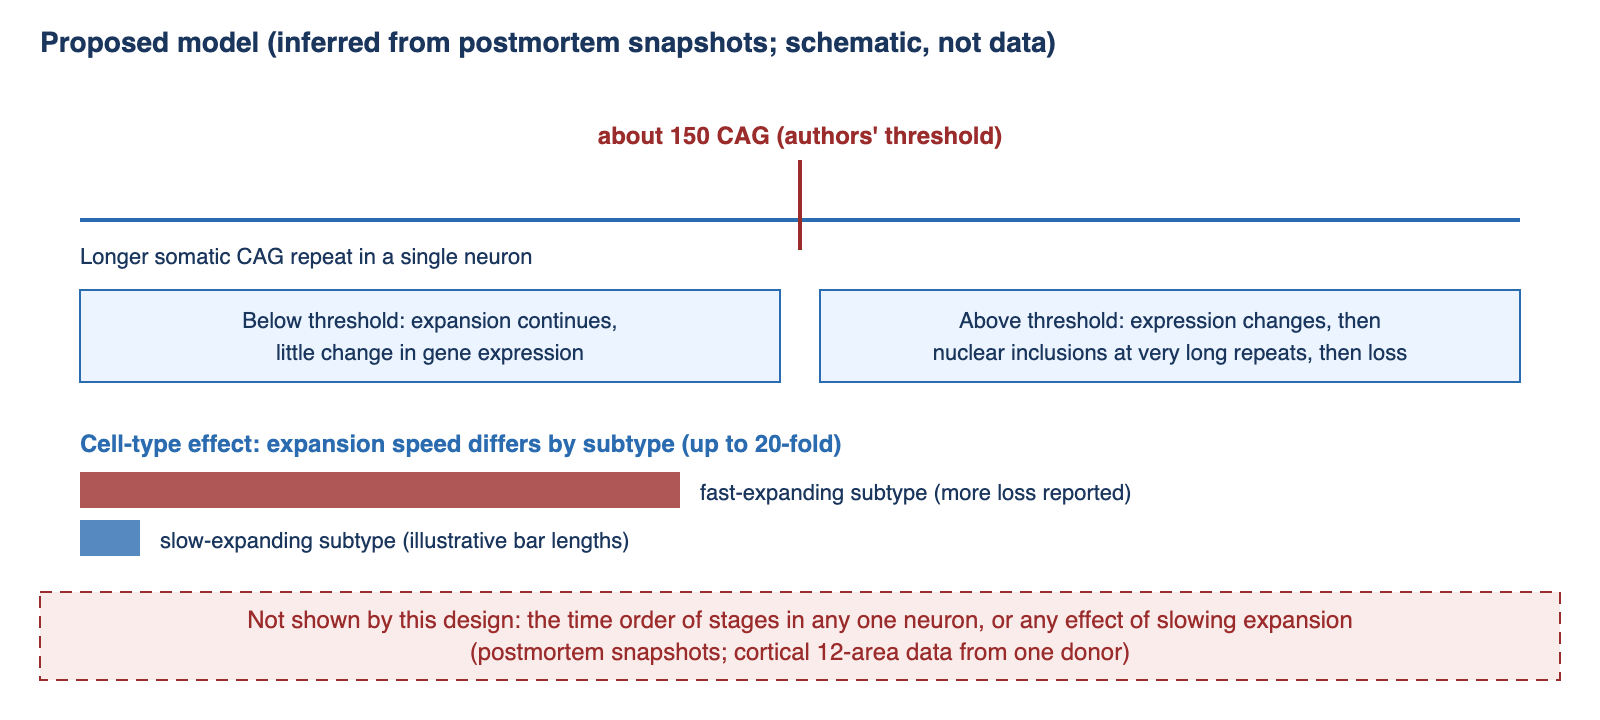
Subtype identity mattered much more than cortical area for expansion rate. Neurons above roughly 150 repeats showed a shared set of expression changes, and nuclei carrying very long repeats were the ones with nuclear HTT inclusions. Because this is a cross-section, the sequence of stages is inferred from distributions, and the most expanded neurons may already be gone, so expansion could be underestimated. The detailed values cited in this post (for example, the subtype percentages and correlation values in the deep dive) are from the preprint v2 text, before comparison with the published version.
Deep dive
1. Background
HD is caused by an inherited CAG repeat expansion in HTT. Inherited length explains much of the variation in age at onset, but the repeat also keeps lengthening in somatic cells, notably in neurons that no longer divide. DNA mismatch-repair genes have been linked to this process, which is why they are discussed as potential drug targets. In striatum, the same research group previously proposed a staged model in which medium spiny projection neurons tolerate expansion up to a threshold near 150 repeats, after which gene expression changes and cells are lost (the authors’ earlier preprint, cited below). The open question addressed here is whether cortical pyramidal neurons follow the same rule or whether cortical pathology is mostly secondary to striatal degeneration and disrupted corticostriatal circuits, as an influential line of work has emphasised.
A 2024 Neuron paper (Pressl et al.) reported selective vulnerability of layer 5a corticostriatal neurons in HD, which gives projection identity a central role. The study discussed here proposes a different emphasis: subtype-specific expansion speed, with projection-type neurons expanding at an intermediate rate rather than the fastest.
2. What this study newly reports
Published-abstract claims. We confirmed three points against the abstract of the published Cell article: toxicity is initiated at about 150 CAG repeats in both cortical and striatal neurons; somatic expansion rates differ by up to 20-fold among pyramidal neuron subtypes; and nuclei with inclusions carry expansions well beyond 150 repeats.
Sample structure (preprint v2). Two distinct layers should not be merged. The paired CAG-plus-RNA layer comes from 11 people with HD (70,760 nuclei, areas BA4 and BA32), and ten additional cortical areas (56,889 nuclei) come from one of those donors. The cell-loss layer is a separate analysis of at least 50 HD and at least 50 control brains. We do not quote a combined sample size because we could not locate one in the text we read.
Detailed values, preprint v2 as of 25 October 2026, not yet compared with the published article.
- In a regression over 46,665 neurons from the single multi-area donor, cortical area changed expansion by at most about 1.3-fold, whereas subtype identity changed it by up to 20-fold. The relative ordering of subtypes was reported as replicated in additional BA4 and BA32 donors.
- In BA32, the share of nuclei above 100 CAG was 43% for layer 6b neurons versus 0.5% for layer 4 intratelencephalic and 0.9% for layer 2/3 intratelencephalic neurons.
- Expression changes above about 150 repeats (“phase C” in the authors’ scheme) were highly similar across cortical layers and areas (r² = 0.8) but very different between cortex and striatum (r² = 0.084).
- Subtypes with the highest expansion (layer 6b and layer 5/6 near-projecting neurons) were reduced by 40 to 60% in HD relative to controls. Five cortical interneuron classes showed no significant HD effect.
- Among nuclei sorted for HTT inclusions, 88 to 99% contained inclusions under the microscope, versus 0 to 2% of unsorted nuclei, and the median CAG length of inclusion-positive nuclei exceeded 200 in every experiment.
- Later-stage changes include re-expression of developmental transcription factors (for example HOX and PAX family genes) and a CDKN2A increase above 40-fold. The authors estimate that cortical neurons spend “perhaps 95-100%” of life with harmless HTT; this is their inference, not a measurement.
Reinterpretation of earlier case-control data. The authors reproduced previously reported cortical differential expression but found that it was nearly the same in vulnerable and resistant cell types and unrelated to a cell’s own CAG length. They read this as a tissue-level secondary response rather than a cell-autonomous effect. That is an interpretation of their own analysis.
What we read. The published Cell article is open access, but automated access to it was blocked in our environment, so we did not read it. We read the full text of the preprint v2 (Abstract through Discussion and figure legends), which carries the same title and author list as the article. We did not read the Methods section or the supplementary data tables. Equivalence of the two versions is our inference, supported by identical title and authors and by near-identical abstracts, with a small wording difference that does not change the meaning.
3. Strengths and limitations of the method
Strengths.
- CAG length and transcriptome are read from the same nucleus, so expansion can be related to expression cell by cell, which case-control comparisons cannot do.
- Predictions were tested against an independent measure: subtypes that expanded faster were the ones reported as lost more often in a separate, larger sample.
- Subtype ordering was checked in additional donors, and an inclusion-sorting experiment tied inclusions to very long repeats.
- The authors state several of their own limits, including survivor bias and unresolved causality of inclusions.
Limitations.
- Cross-sectional inference. Stage order and any timing statements come from where cells fall on a distribution at one moment of death, not from tracking cells.
- Donor dependence. The 12-area analysis rests on one donor; the cortical inclusion analysis used two donors. Between-person variation in repeat length, age and disease stage cannot be estimated well from this.
- Survivor bias, acknowledged by the authors. The most expanded neurons in the most vulnerable subtypes may already have died, which would make expansion and the apparent threshold look lower or less extreme than they were. In the inclusion experiment, one vulnerable subtype was nearly absent from the sorted material.
- Technical noise at the rare end. The authors disregarded late-stage expression events below 150 repeats because their frequency was below the rate of cell-barcode switching. That is a reasonable control, but it means technical artefact bounds determined where claims could be made.
- Causality not settled. Whether inclusions cause toxicity is left open by the authors, who note that downstream atrophy, inflammation and circuit disconnection may account for much of the symptoms.
- No independent replication. This is an extension of the same group’s striatal work.
- Version caveat. Detailed values are from the preprint v2.
4. Connections to neighbouring domains
DNA repair and drug targets. The authors report that expansion rate across subtypes was not explained by nuclear RNA levels of HTT or of mismatch-repair genes such as MLH1, MLH3, PMS1 and LIG1. If a target gene’s expression does not predict where expansion is fast, then assuming that a repair-gene therapy will act uniformly, or only in striatum, needs direct testing in each cell type. This is the most concrete bridge from the paper to drug development, though the negative result is itself a single-study observation.
Single-cell atlases and machine learning. Fine-grained subtypes from standard cortical taxonomies differed in a functional property (expansion speed) by up to 20-fold. This gives automated cell-type annotation and single-cell foundation models a concrete validation question: do subtype boundaries predict disease vulnerability, not only expression similarity?
Epigenetics. In the late stage the authors note that re-expression of developmental genes and a strong CDKN2A rise resemble features of polycomb (PRC2) loss in mouse models, and describe this connection as “intriguing to consider”. It is untested here and should be treated as a speculation.
5. Commercialisation and investment perspective
TRL 2 (our estimate). The work formalises a mechanism from human observational data. It contains no intervention, so it provides no clinical evidence for any therapy aimed at somatic expansion.
Timeline. We make no timeline estimate; it would depend on separate programmes that this paper does not evaluate.
Registered HD clinical programmes (ClinicalTrials.gov, facts only). The registered late-stage and clinical HD assets we checked mainly aim to lower HTT, not to suppress somatic expansion:
- AMT-130, an AAV gene therapy (uniQure): Phase 1/2 studies NCT04120493 and NCT05243017, listed as active, not recruiting.
- PTC518 (votoplam): Phase 2 NCT05358717 listed as completed, with an extension study NCT06254482; the registry lists Novartis as sponsor.
- Tominersen (Roche): Phase 2 GENERATION HD2, NCT05686551.
We did not survey clinical-stage programmes directed at somatic expansion (for example against MSH3 or PMS1), so we make no statement about them. This list is a registry snapshot and carries no view on any company.
Funding. CHDI Foundation, a non-profit organisation that develops and supports HD therapeutics, is among the funders (see Disclosure). The authors’ conclusion that slowing expansion may be a therapeutic lever points in the same direction as that funder’s mission; we state this as a fact and draw no conclusion from it.
6. Counterarguments
- Directly competing interpretation. Pressl et al. (Neuron 2024) emphasised vulnerability of layer 5a corticostriatal neurons. The Cell paper offers a different account, in which projection identity matters less than subtype-specific expansion speed. It presents an alternative model; it does not disprove the earlier one, and the two may both be partly right.
- Inference from snapshots. A stage order drawn from distributions at death can be reshaped by who survived, by disease duration and by sample handling. Without longitudinal or experimental manipulation, the claim of a shared, sequential process stays a model.
- One donor for the broadest claim. Generality across twelve cortical areas depends on a single person, and the cortical inclusion analysis on two.
- Survivor bias. The authors state that expansion in the most vulnerable subtypes may be underestimated because the most expanded cells are gone. This weakens any estimate of the threshold itself.
- Correlation of expansion with loss. Cell types that expand fastest are also those reported as lost most; this fits causation but does not isolate it from other vulnerabilities that co-vary with subtype.
- Version dependence. The finer-grained numbers come from the preprint v2. A change between versions is unlikely given matching titles, authors and abstracts, but we have not verified it.
- Source of interest. The authors declare no competing interests. The work was funded in part by CHDI Foundation, whose purpose is HD therapeutic development. All quantitative claims here are the authors’ own and have not been independently reproduced.
7. Indicators to watch
- Comparison of the published article’s tables with the preprint values cited here, and any correction.
- Independent datasets with paired CAG and RNA from more donors, particularly beyond the single multi-area donor.
- Experimental tests of the 150-repeat threshold in models where expansion can be tuned, and tests of whether reducing expansion in cortical neurons preserves them.
- Evidence on which cell types express which expansion-modifying genes, given the negative expression result.
- Responses from groups that have emphasised corticostriatal projection vulnerability.
- Clinical-stage programmes directed at somatic expansion and the cell types and biomarkers they choose to follow.
References
The Cell article is open access, but we could not open it; our detailed reading is of the authors’ bioRxiv v2 text. Entries for other works are listed with the details we could confirm.
- Kashin, Seva, Won-Seok Lee, Tara M. McDonald, et al. (13 authors; the McCarroll laboratory, Broad Institute). 2026. “Somatic DNA-repeat expansions initiate distinct yet analogous changes in Huntington’s disease cortical and striatal neurons.” Cell (published online October 2026; PubMed PMID 42950817). DOI: 10.1016/j.cell.2026.10.001
- Same authors. 2026 (version 2, posted 25 October 2026). Preprint of the same study, bioRxiv (not peer reviewed; first posted 11 December 2025 under a different title, “A shared DNA-repeat toxicity threshold, reached somatically at cell-type-specific rates, unites cortical and striatal neurodegeneration in Huntingtons disease”). DOI: 10.64898/2025.12.09.688862
- Same research group. 2024. Preprint on somatic expansion and a staged model in striatum, bioRxiv. DOI: 10.1101/2024.05.17.592722. (A journal version is reported by the group; we have not confirmed its citation, so we cite the preprint.)
- Pressl, Christina, Kert Mätlik, Laura Kus, et al. 2024. “Selective vulnerability of layer 5a corticostriatal neurons in Huntington’s disease.” Neuron 112 (6): 924-941.e10. DOI: 10.1016/j.neuron.2023.12.009.
- Bates, Gillian P. 2025. “Somatic CAG-repeat expansion drives neuronal loss in Huntington’s disease.” Neuron 113 (3): 342-344. DOI: 10.1016/j.neuron.2025.01.008. (Title, volume and pages matched in Crossref; text not read.)
- ClinicalTrials.gov registry records NCT04120493, NCT05243017, NCT05358717, NCT06254482 and NCT05686551, accessed 2026-11-03: https://clinicaltrials.gov/
Disclosure
- This article is for informational purposes only and is not investment advice.
- The author holds no position in any company named in this post.
- Conflict-of-interest notes (from the article and preprint):
- The Cell article’s declaration of interests states: “The authors declare no competing interests.” The preprint v2 declaration is to the same effect.
- Funding listed in the preprint v2 acknowledgements and in Crossref funder records: CHDI Foundation, a non-profit organisation that develops and supports Huntington’s disease therapeutics; a Harvard Medical School Ludwig neurodegeneration seed grant; NHGRI grant R01HG006855; and the Harvard Medical School Department of Genetics. The corresponding author lists a Howard Hughes Medical Institute affiliation. No company funding is stated.
- The authors’ conclusion that slowing somatic expansion may be a therapeutic lever and the funder’s therapeutic-development mission point in the same direction. All quantitative results here are the authors’ claims and have not been independently reproduced; they extend the same group’s earlier striatal work.
- Our reading covered the full text of the bioRxiv v2 preprint (abstract, introduction, results, discussion, limitations, acknowledgements, declarations and figure legends) and the published abstract and declaration via PubMed. The Cell article body, the Methods section and the supplementary data tables were not read.
- The figure in this article is an original drawing; no figure from the source was reproduced.


Leave a Reply